📖 Background
This project was created during my time at Neuromatch Academy's Deep Learning track — an intensive computational neuroscience and deep learning summer school.
I was fascinated by the question: What's actually happening inside these networks? This led me down the path of mechanistic interpretability — understanding the internal mechanisms of neural networks by visualizing their learned representations.
Looking back, I was exploring mech interp before it became the hot topic it is today! 🔥
🔬 The Question
What do the intermediate representations look like, and how do they evolve through the network?
1. Learned Convolutional Filters
The first layer learns to detect basic features like edges, gradients, and textures. Deeper layers combine these into more complex, abstract features.
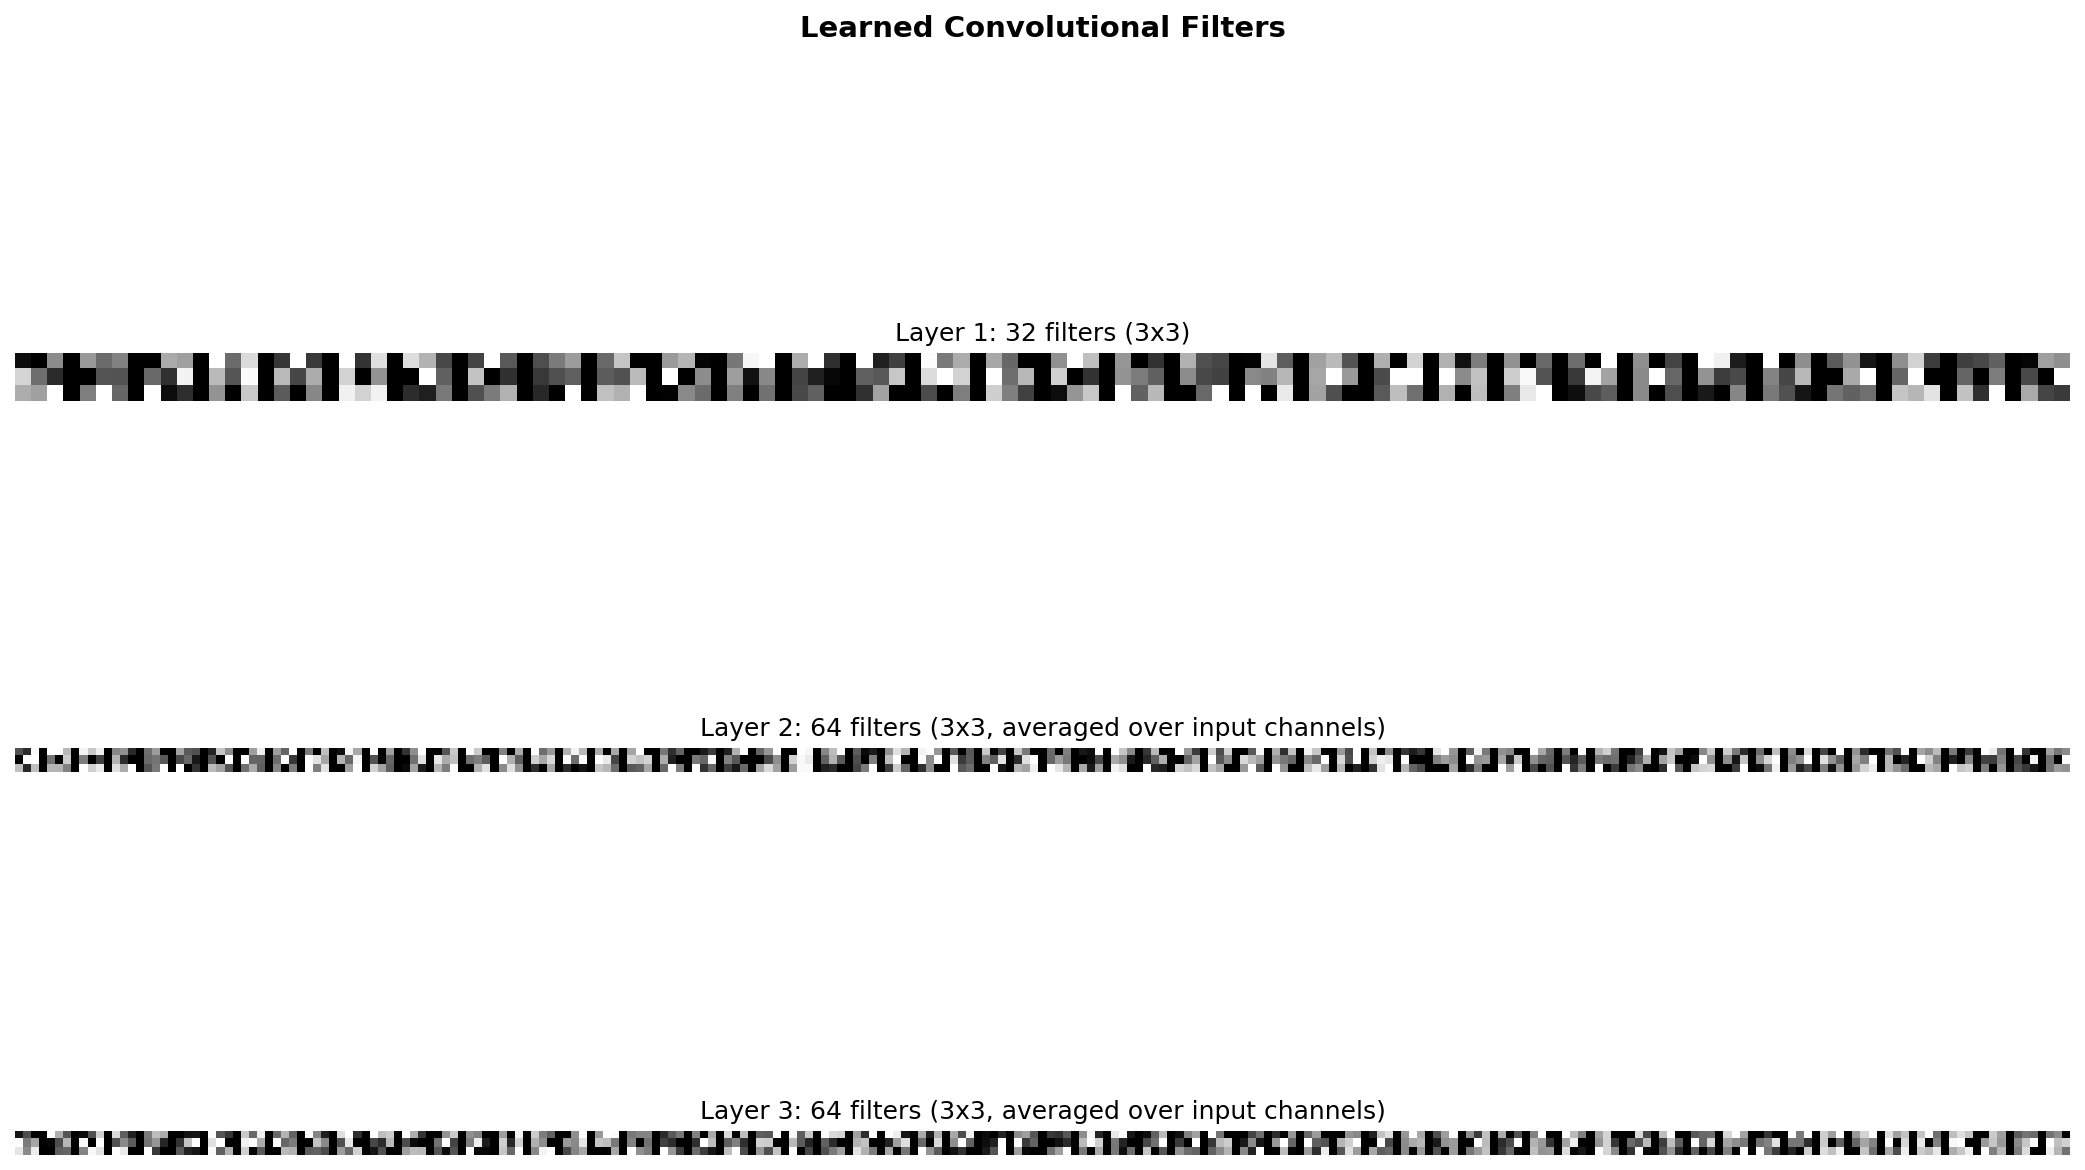
Observations
- • Layer 1 filters detect simple patterns (edges, gradients)
- • Deeper layers combine these into complex features
- • Filters show diverse orientations and frequencies
2. Feature Maps (Activations)
Each filter produces an activation map showing where it "fires" in the input. Watch how spatial resolution decreases but feature richness increases through layers.
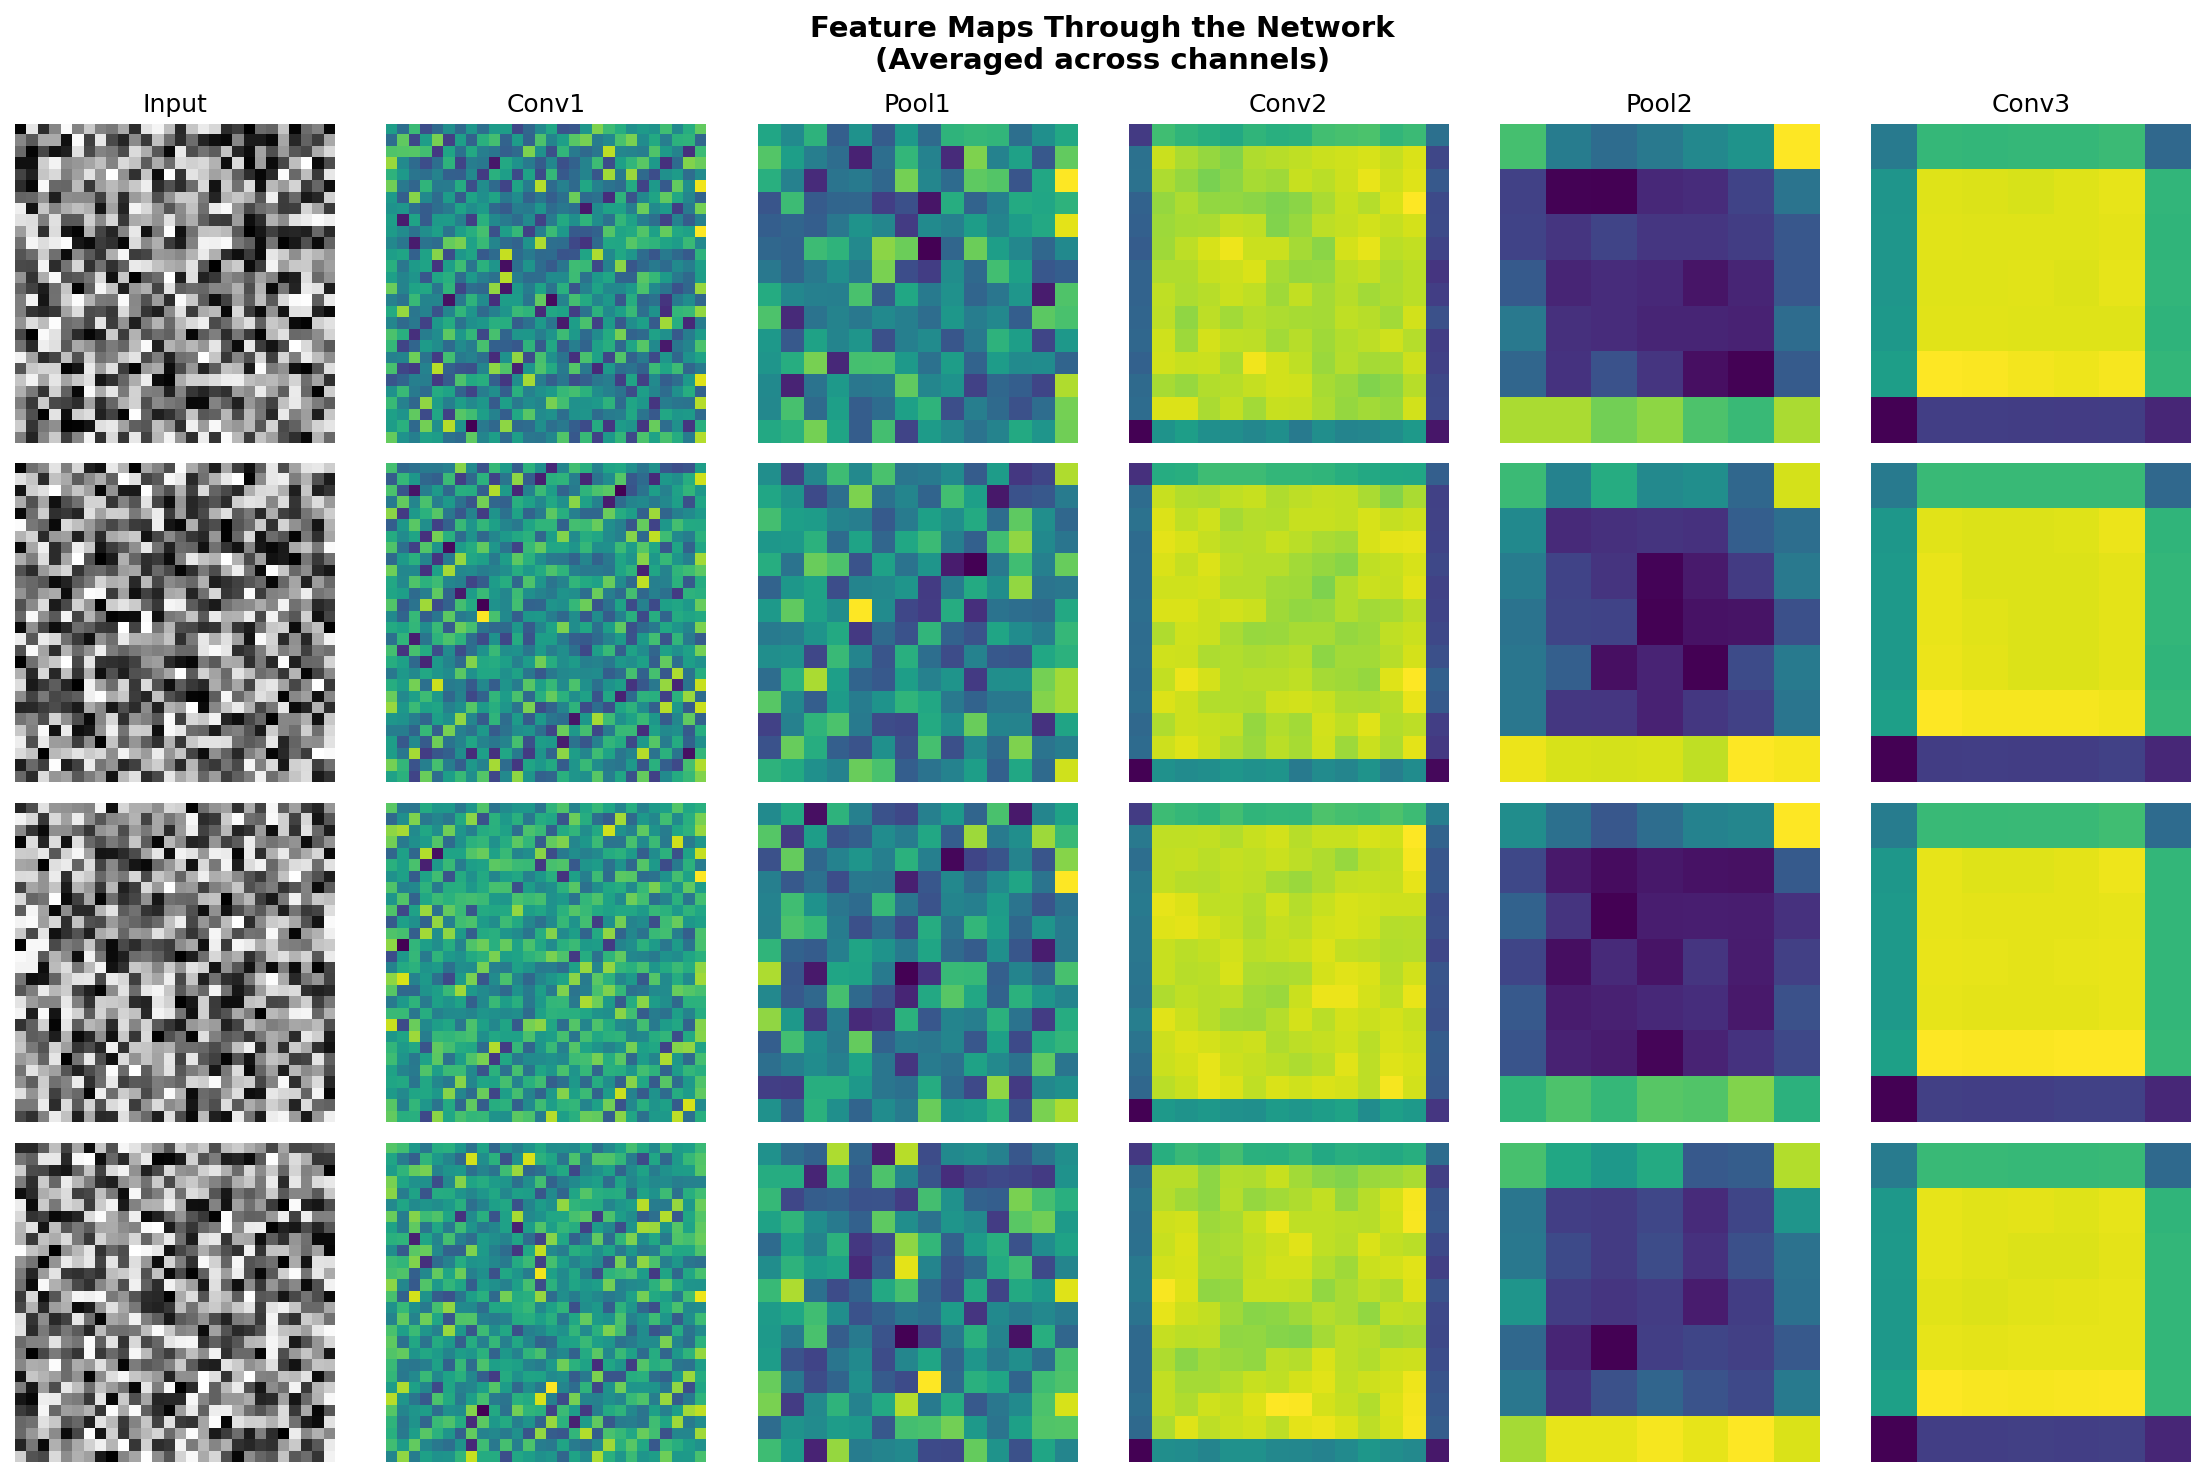
Observations
- • Early layers preserve spatial structure
- • Deeper layers: smaller spatial resolution, richer features
- • Different channels respond to different input aspects
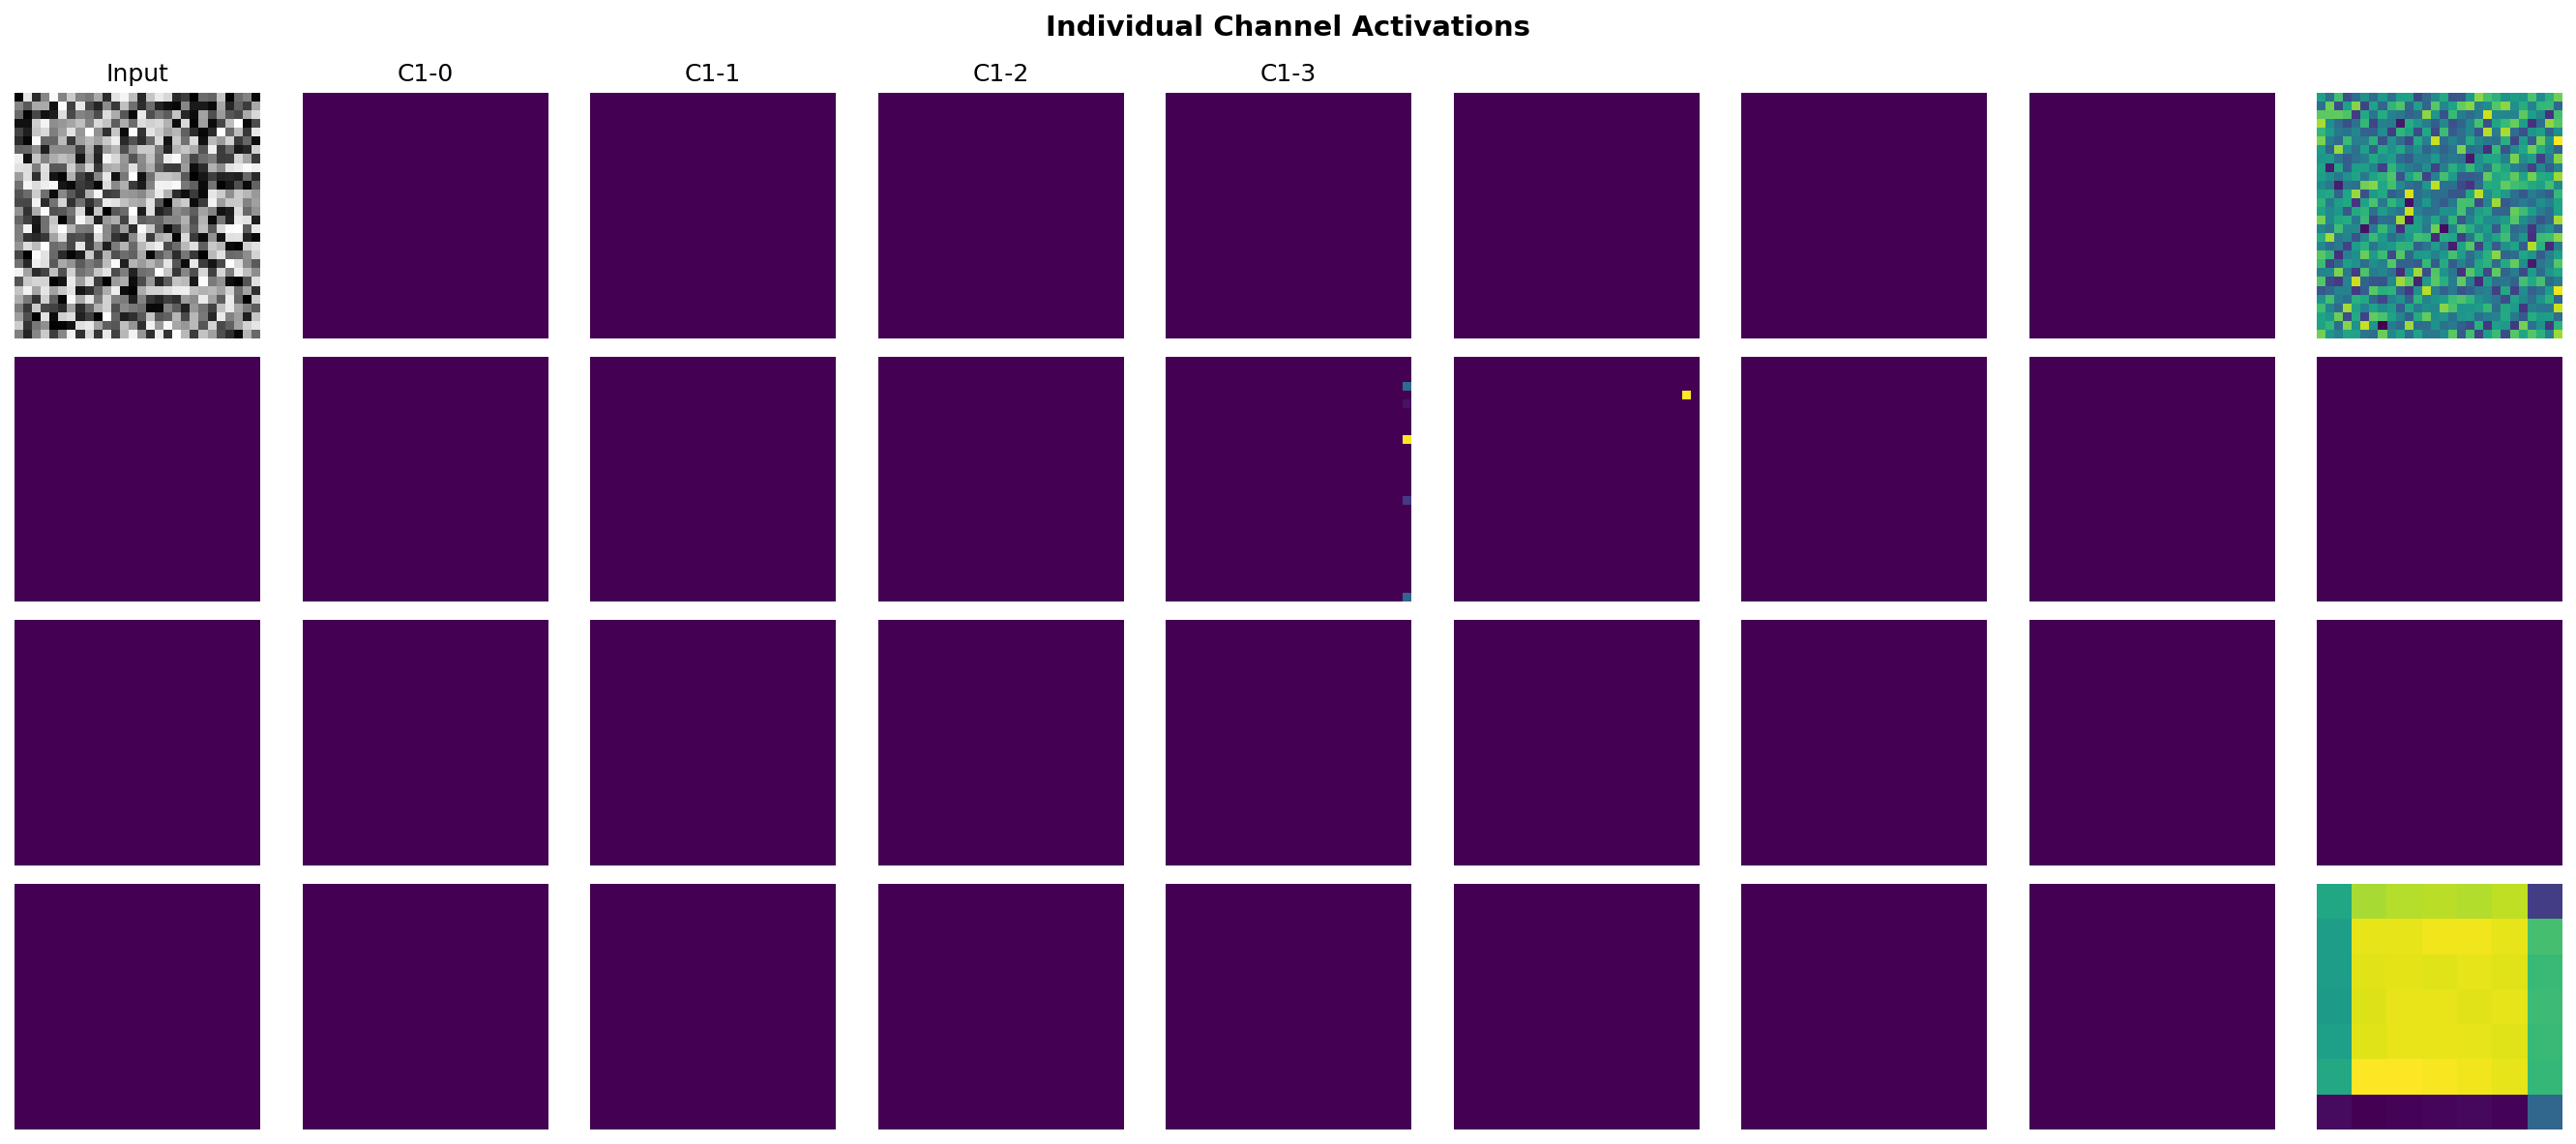
3. Individual Channel Activations
Each channel in a layer responds to different features. Some act as edge detectors, others respond to textures or patterns.
📐 Technical Details
Architecture
SimpleCNN:
├── Conv(32, 3×3) + ReLU + Pool
├── Conv(64, 3×3) + ReLU + Pool
├── Conv(64, 3×3) + ReLU
├── Flatten → Dense(128)
└── Output(10)
Stack
- • Framework: JAX/Flax
- • Hardware: TPU v4
- • Dataset: MNIST
- • Context: Neuromatch Academy
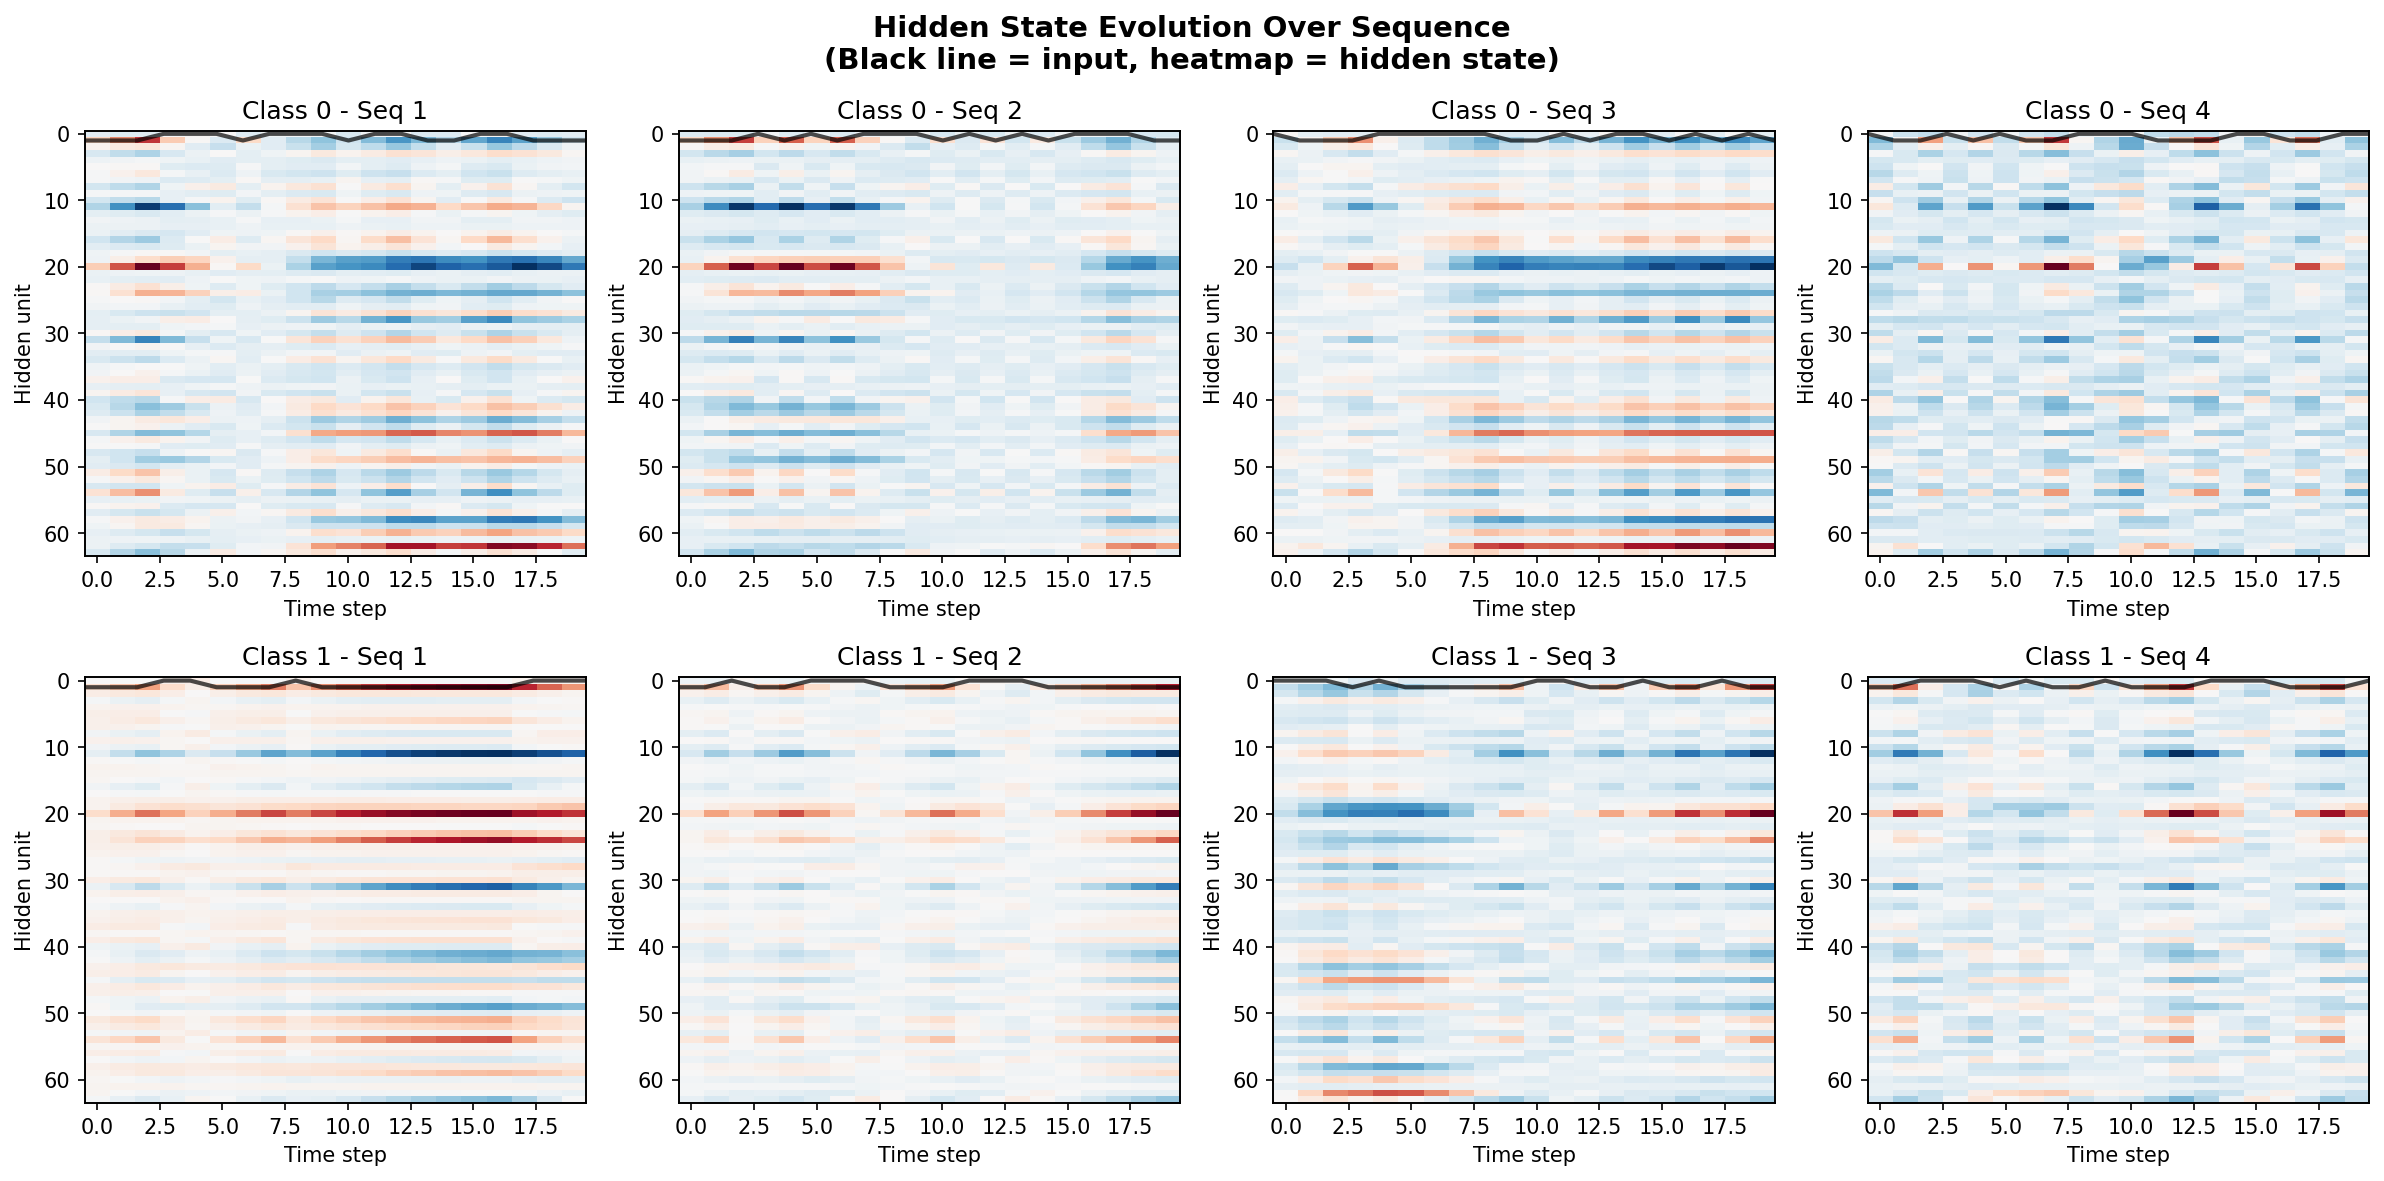
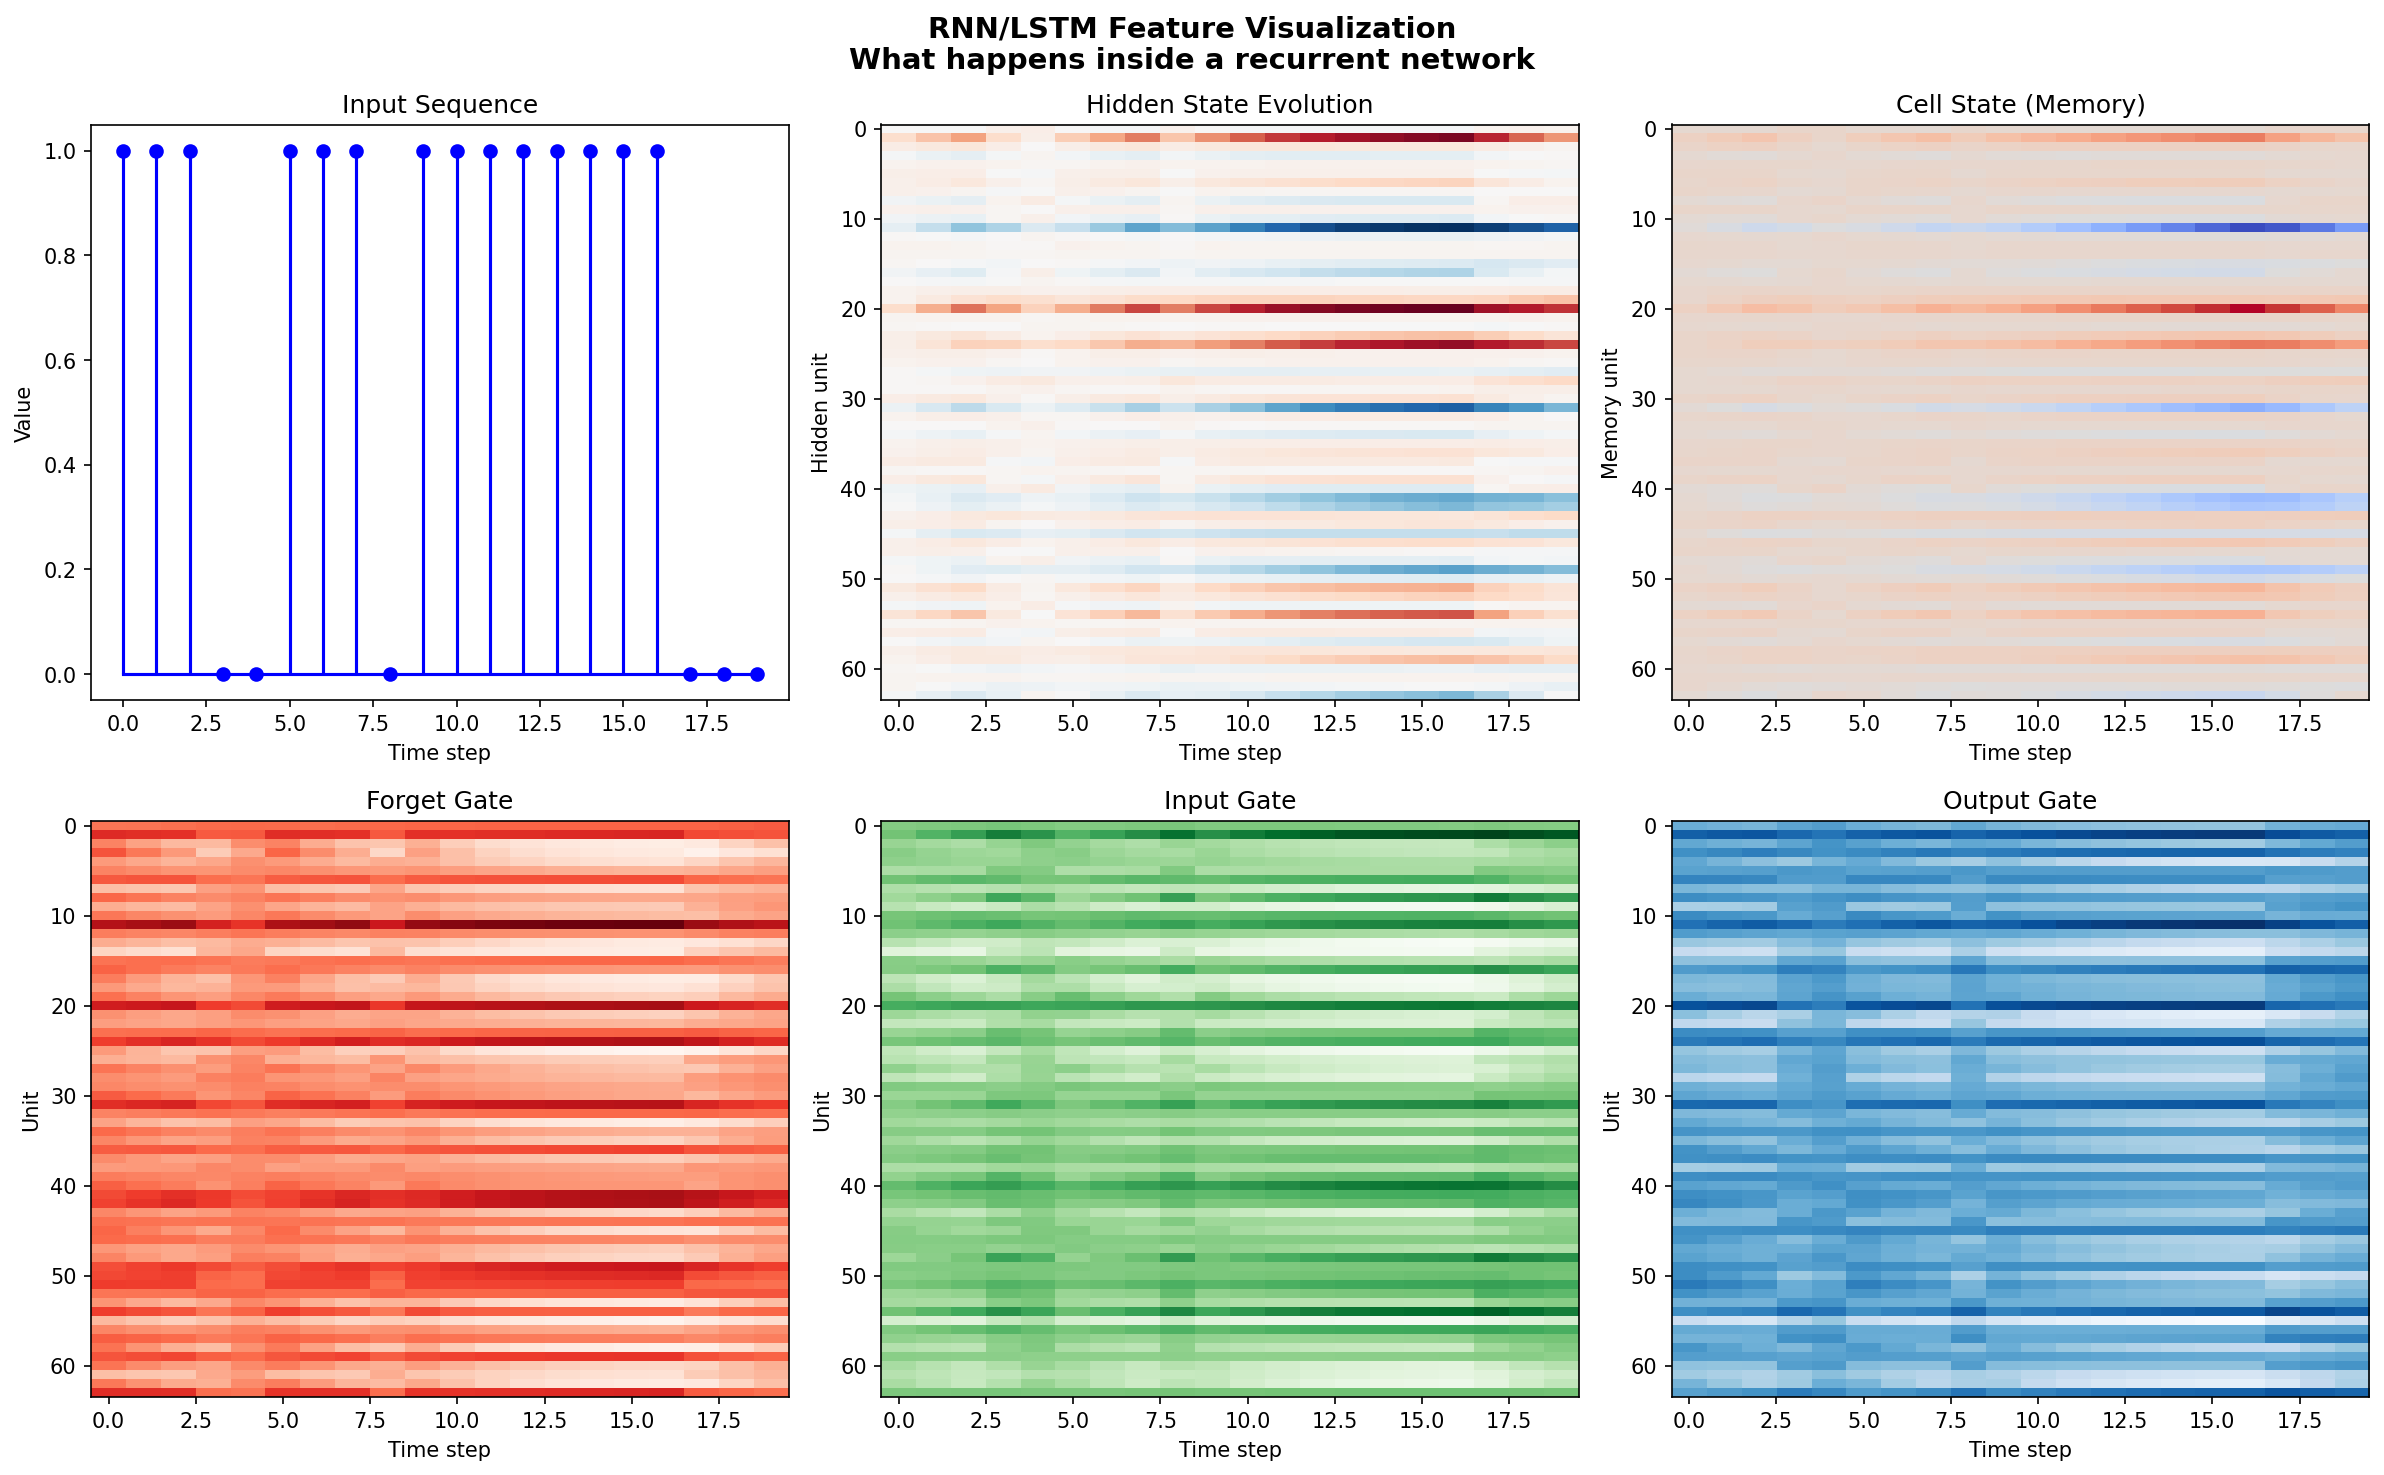
Part 2: RNN/LSTM Visualization
What happens inside recurrent networks?
4. Hidden State Evolution
As the LSTM processes each element in the sequence, its hidden state evolves to encode relevant information.
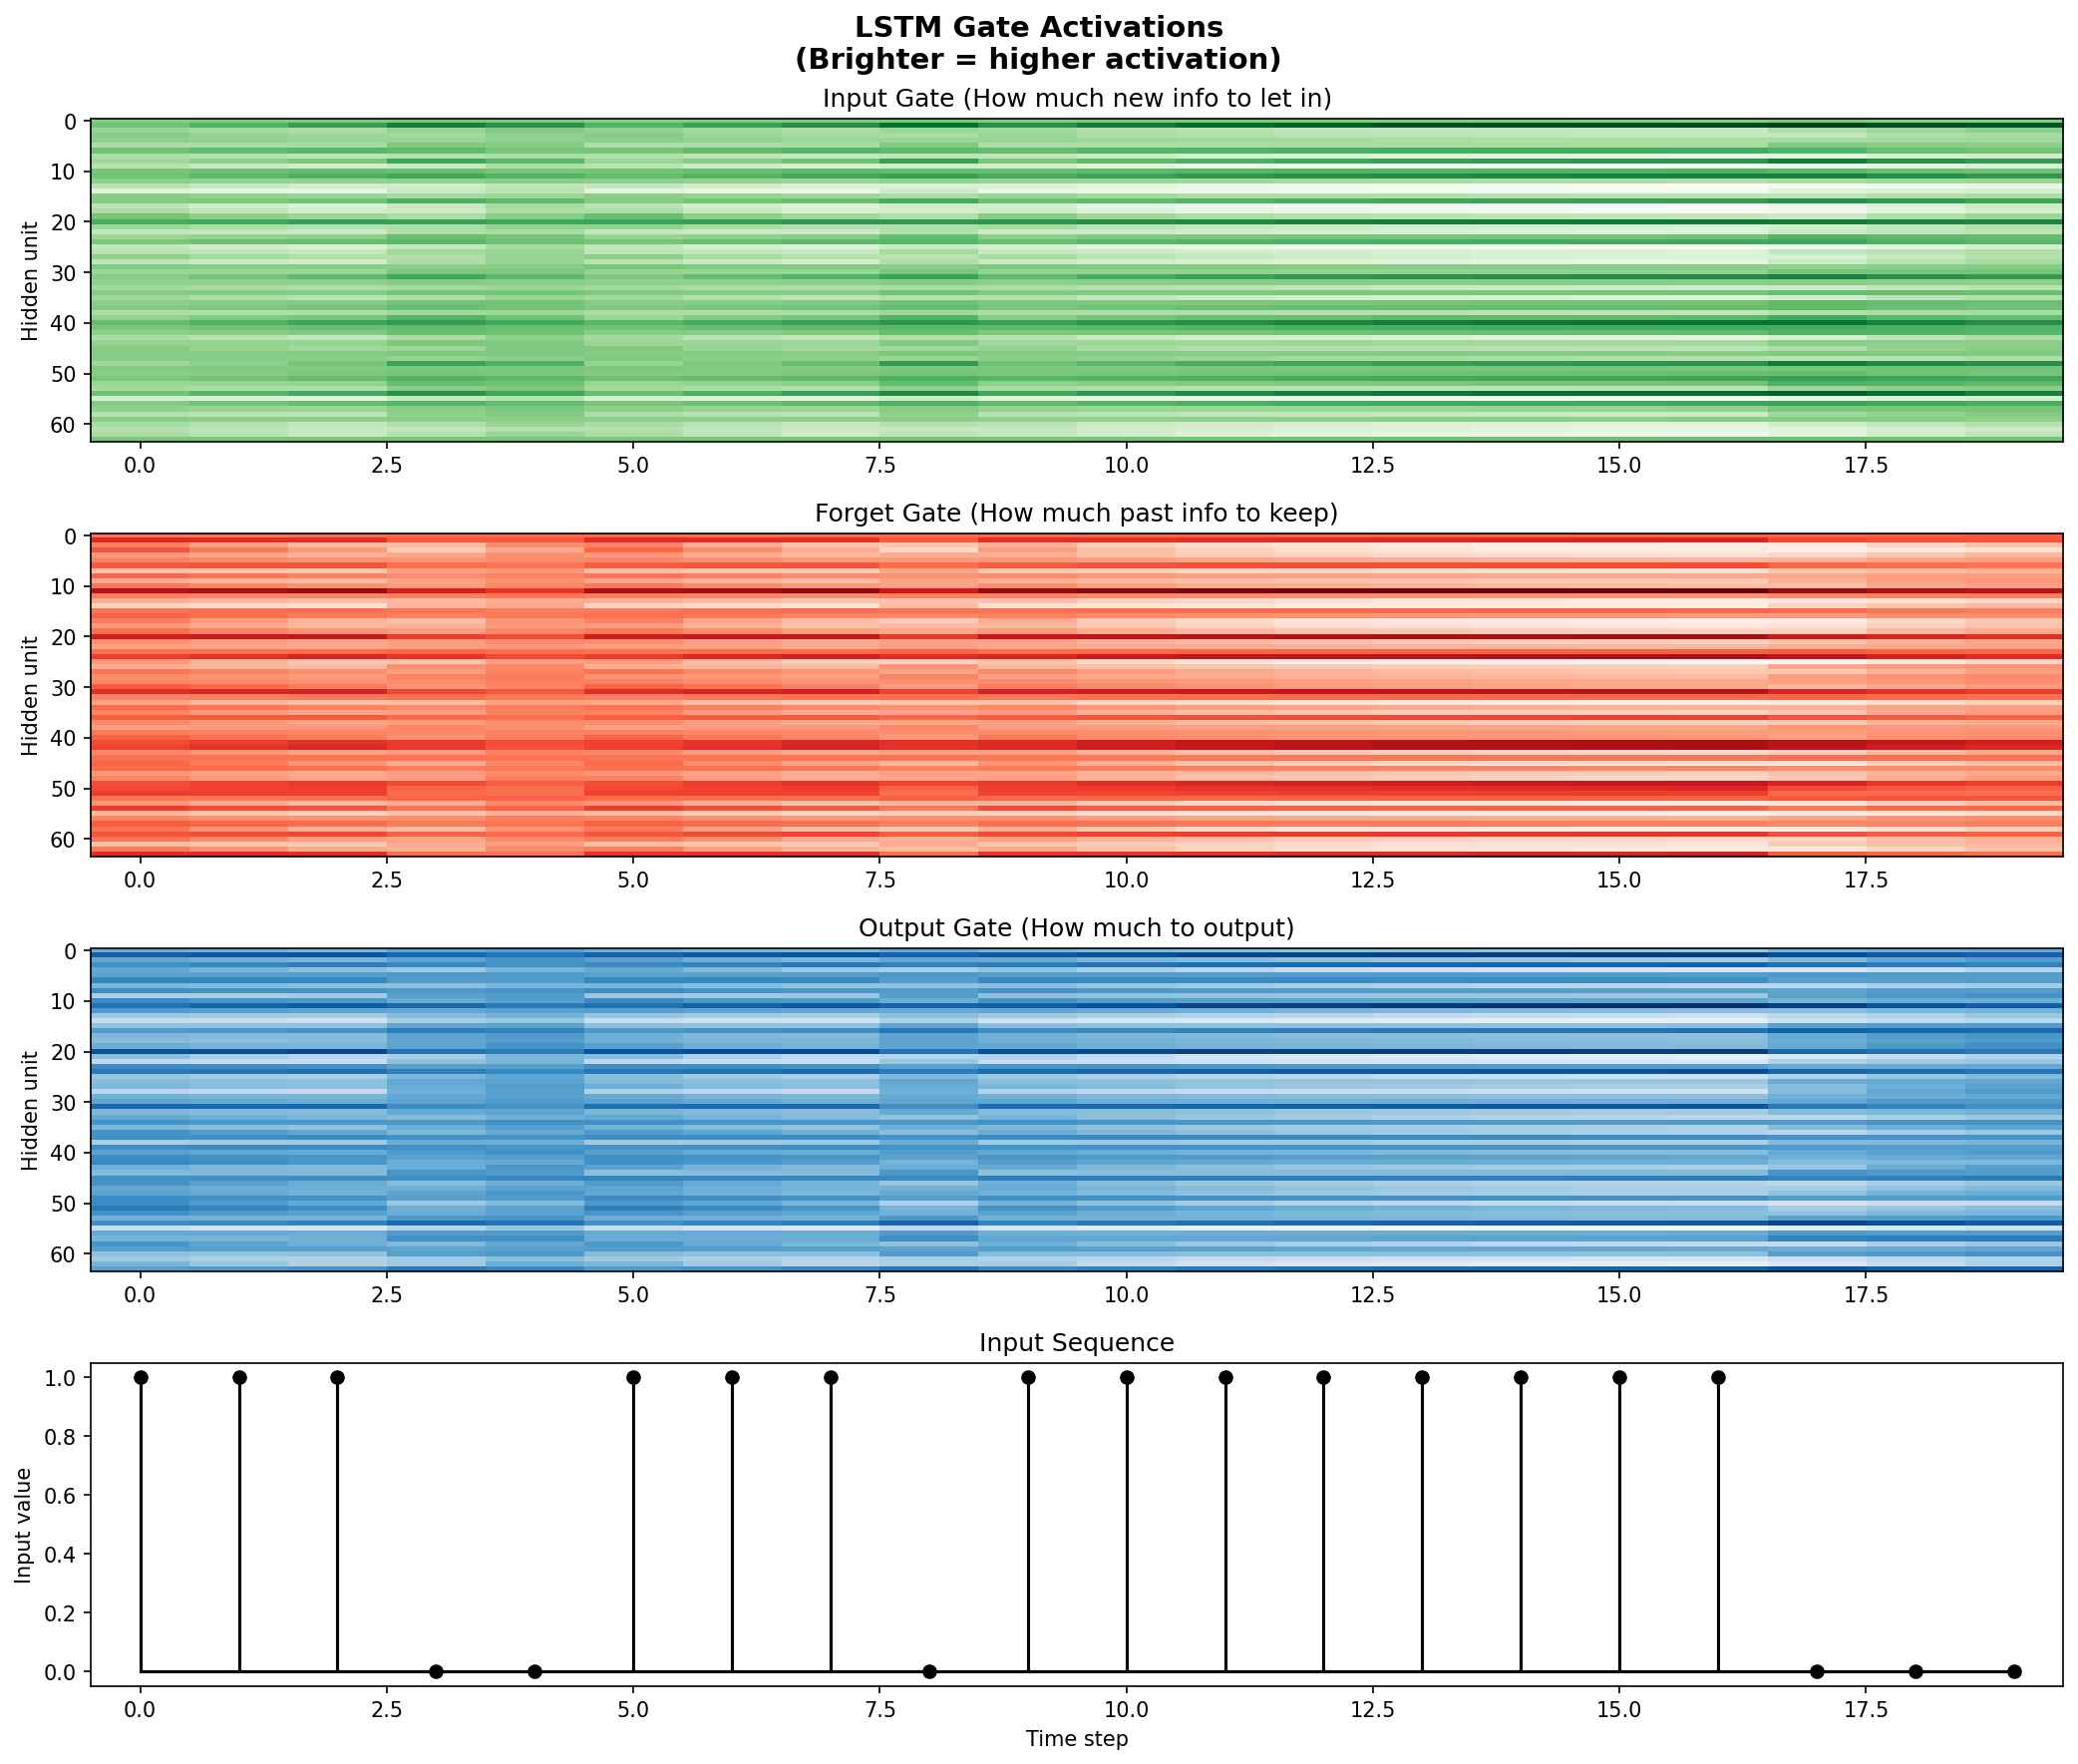
5. LSTM Gate Activations
The three gates control information flow through the network:
Forget Gate
What to discard from memory
Input Gate
What new info to store
Output Gate
What to output
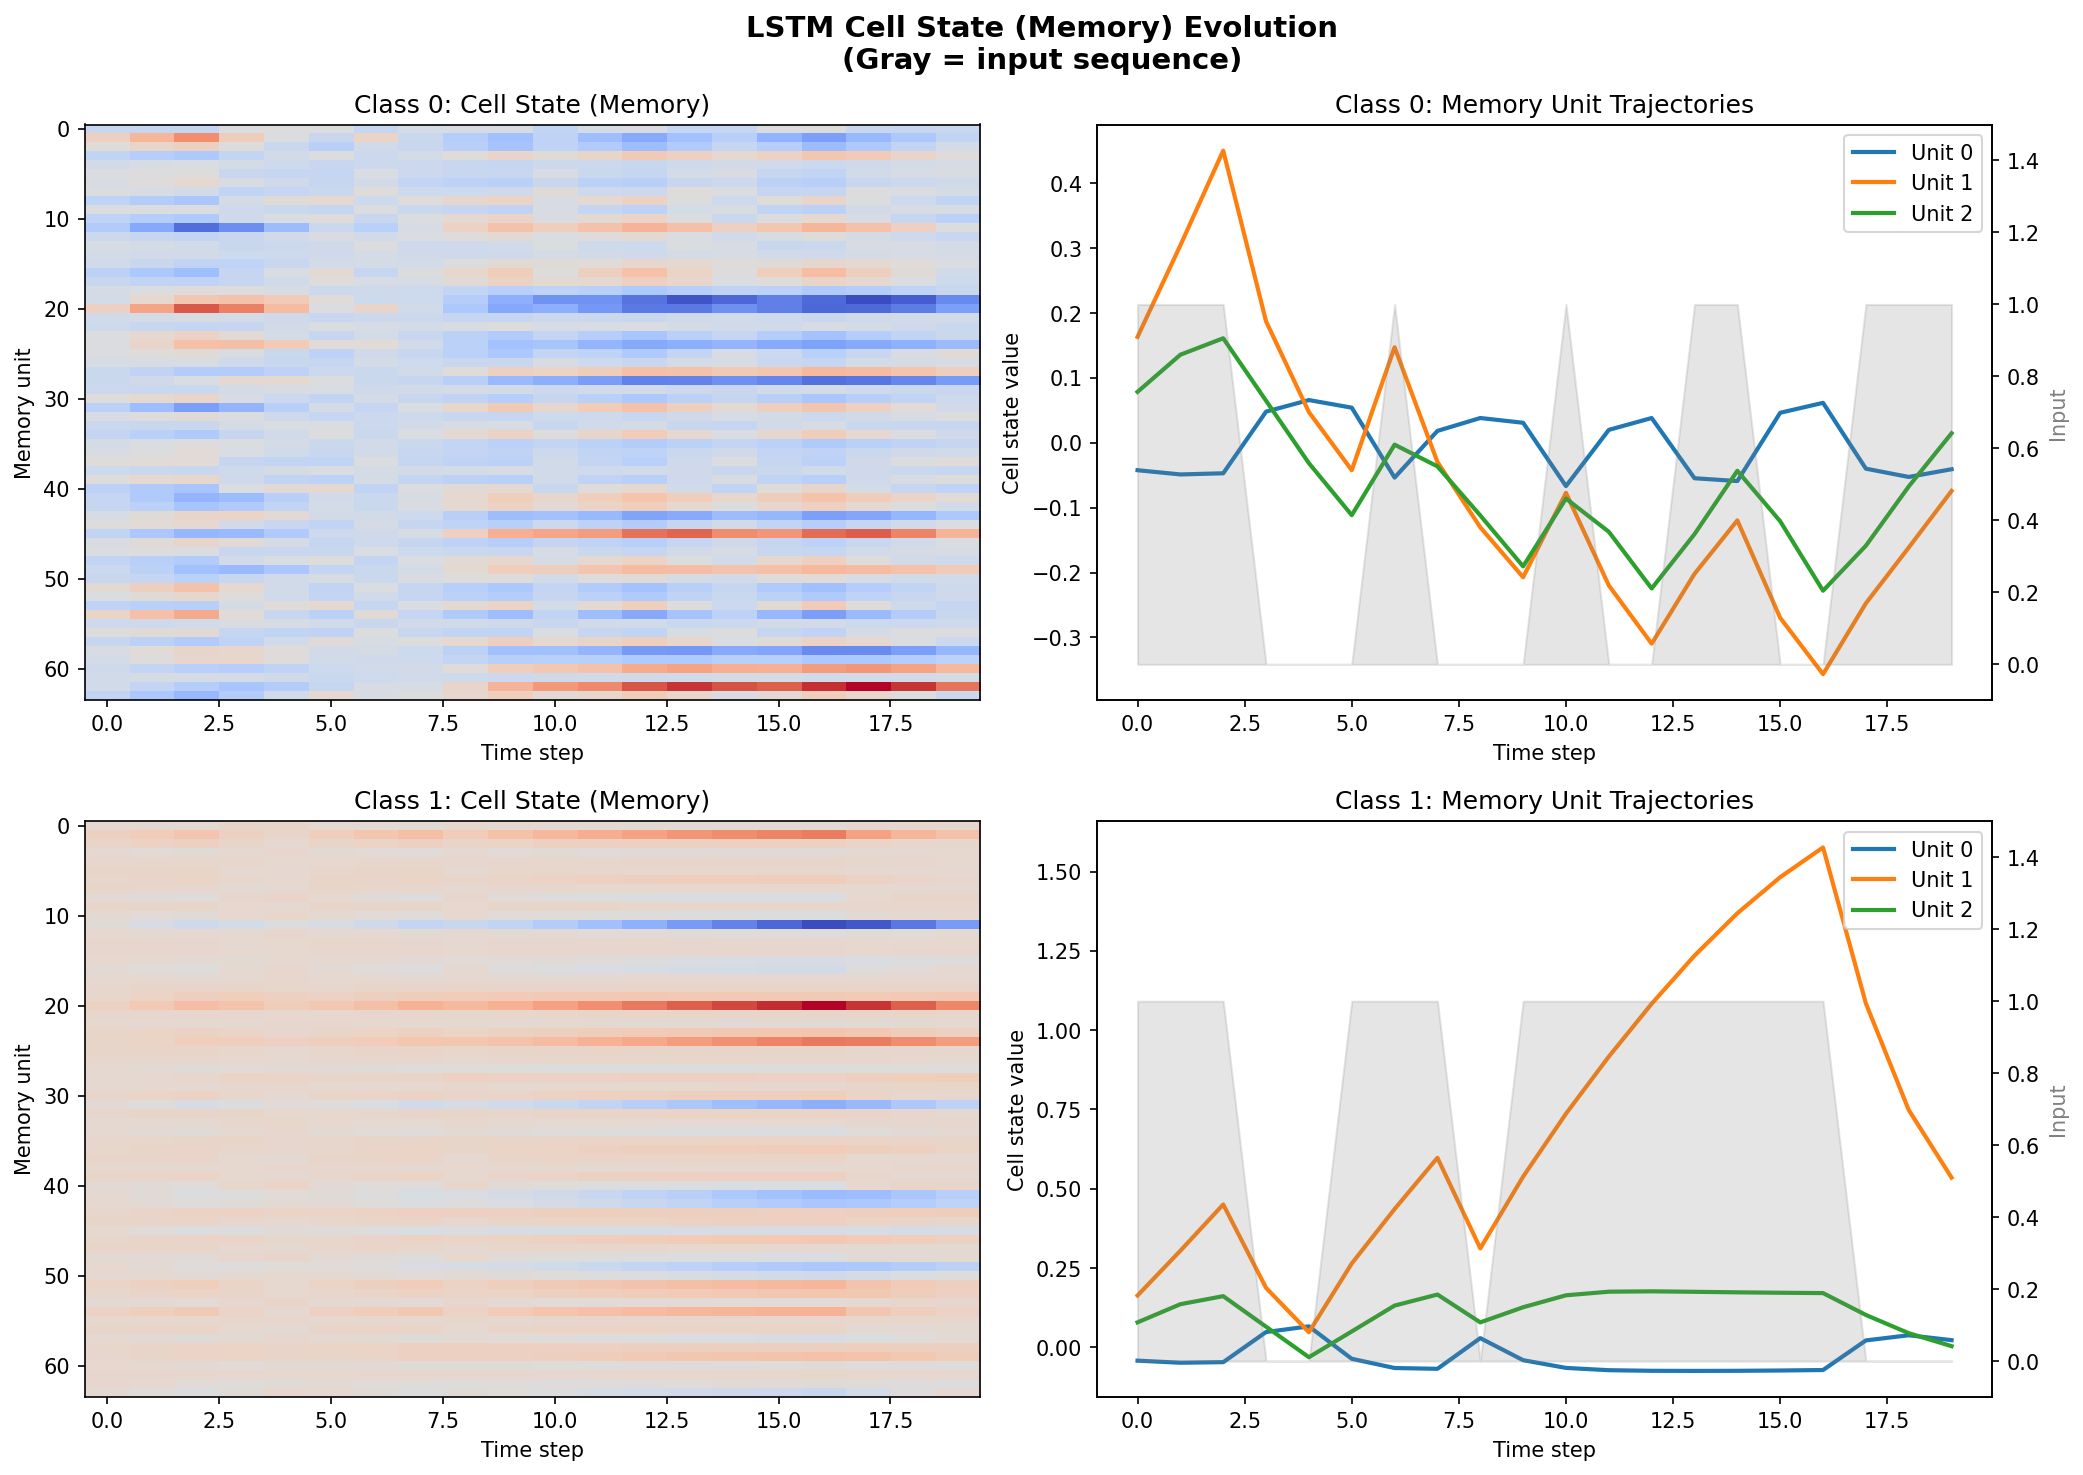
6. Cell State (Memory) Dynamics
The cell state carries information across the sequence — the LSTM's "memory".
7. RNN Summary
🎯 Task & Results
Task: Count if a binary sequence has more 1s than 0s
Test Accuracy: 100% — The LSTM learns to count!
💡 Key Findings
CNNs:
- 1. Hierarchical representations (edges → patterns)
- 2. Different filters specialize in different features
- 3. Spatial relationships preserved
RNNs/LSTMs:
- 1. Gates control what to remember/forget
- 2. Cell state maintains long-term memory
- 3. Hidden state encodes sequence context