My ML Journey
2022 — First steps into Machine Learning & Data Science
🌐 Public Repository — View on GitHub →This is where my journey into AI and data science began. A collection of projects working through classic ML problems — from exploratory data analysis to building neural networks from scratch.
📑 Projects
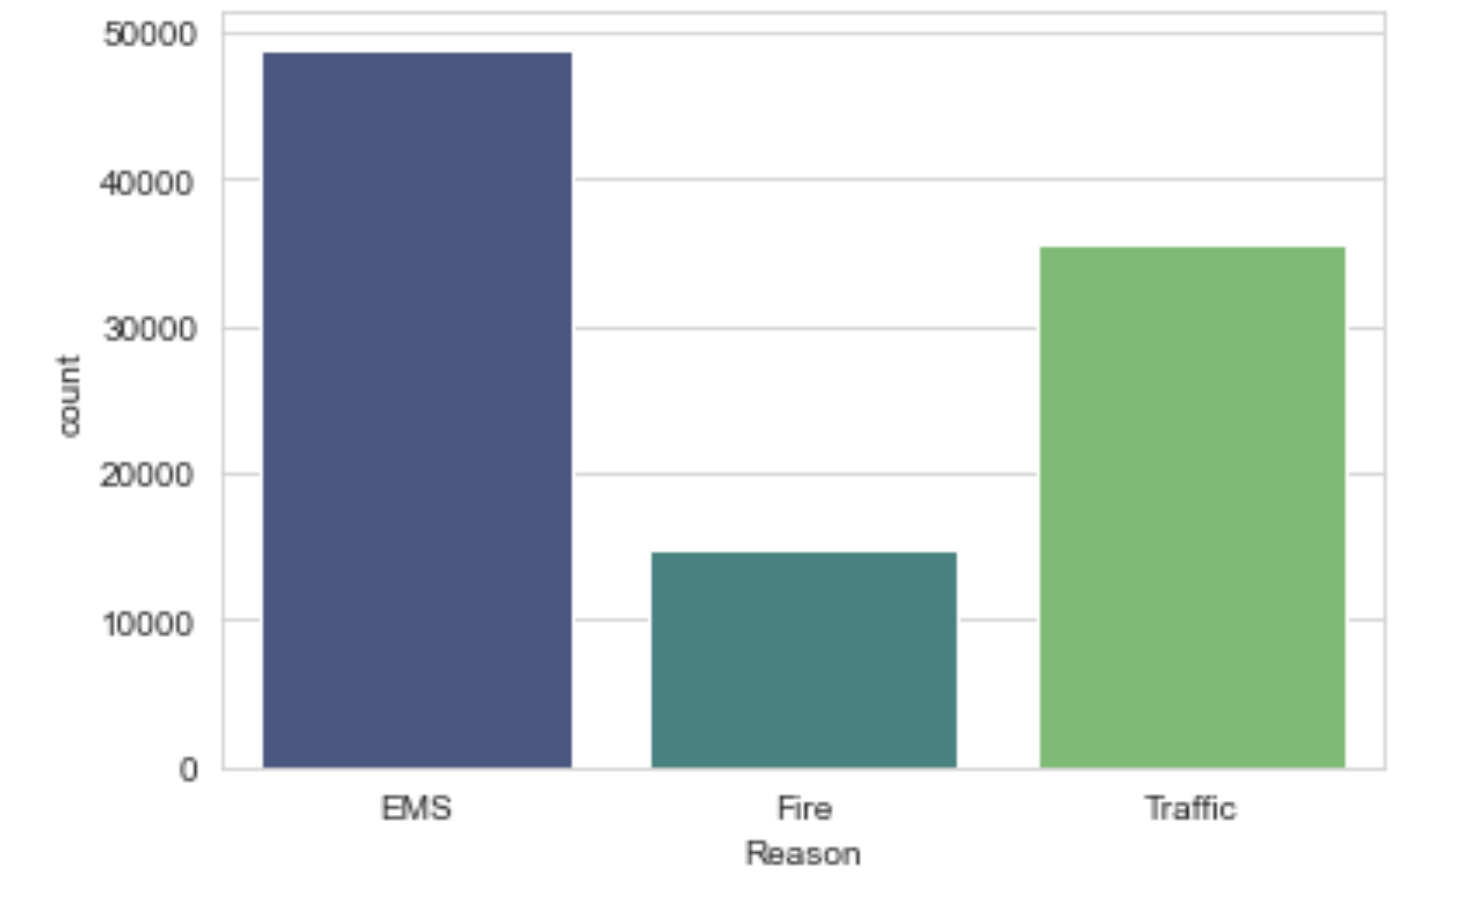
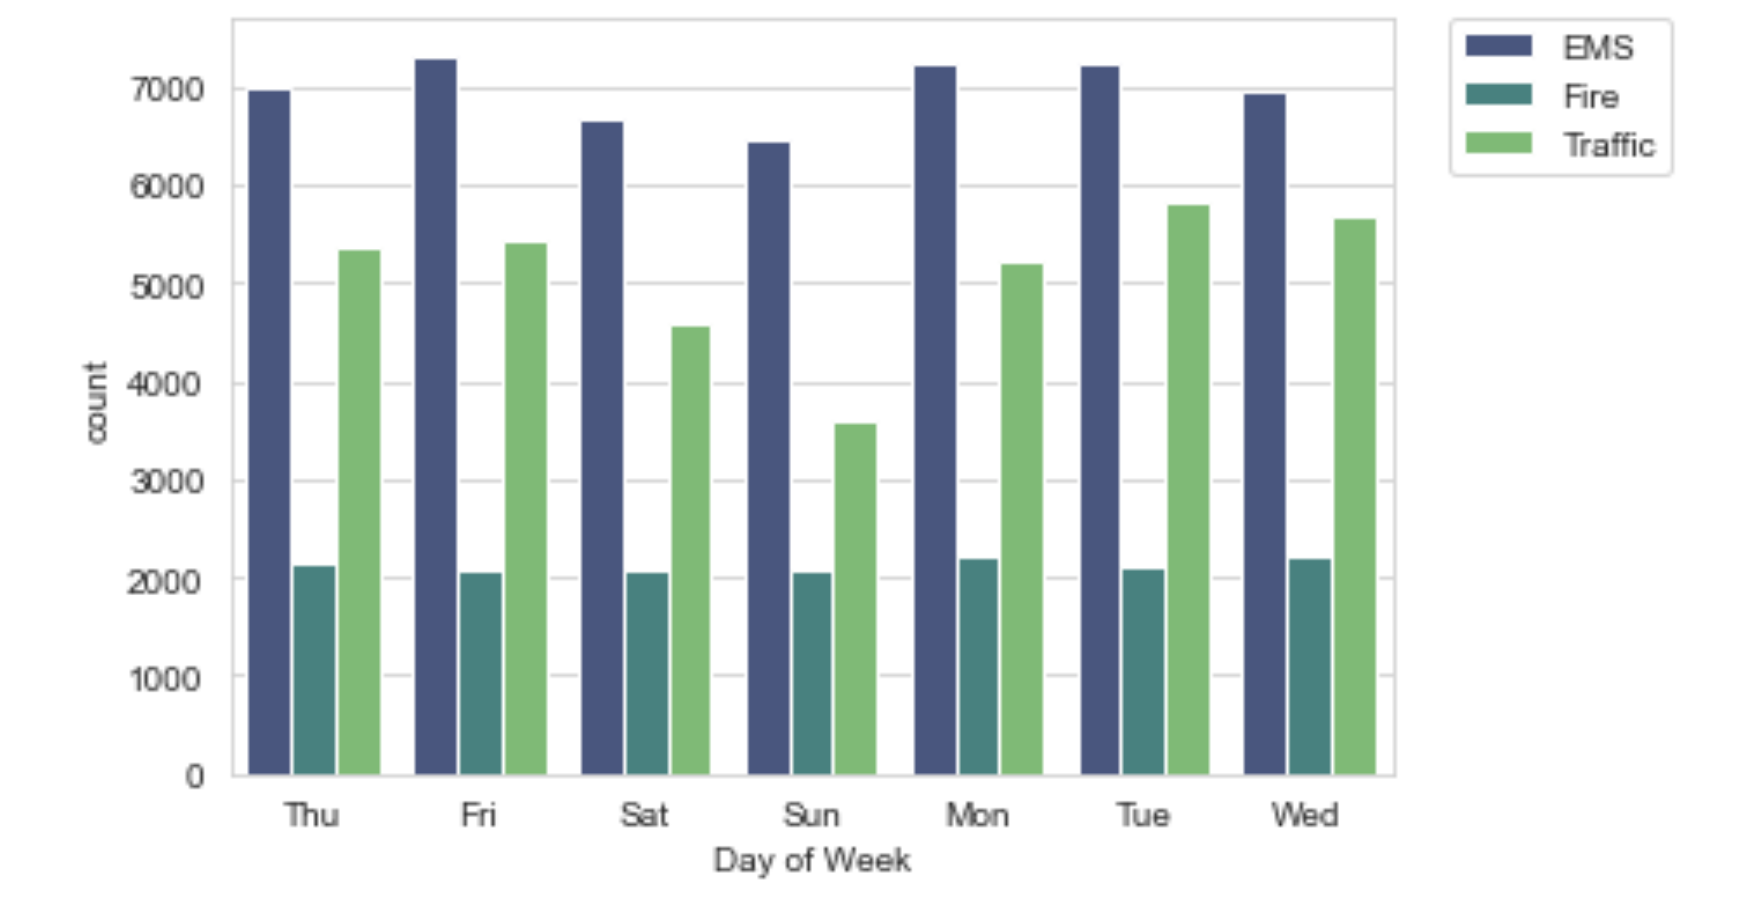
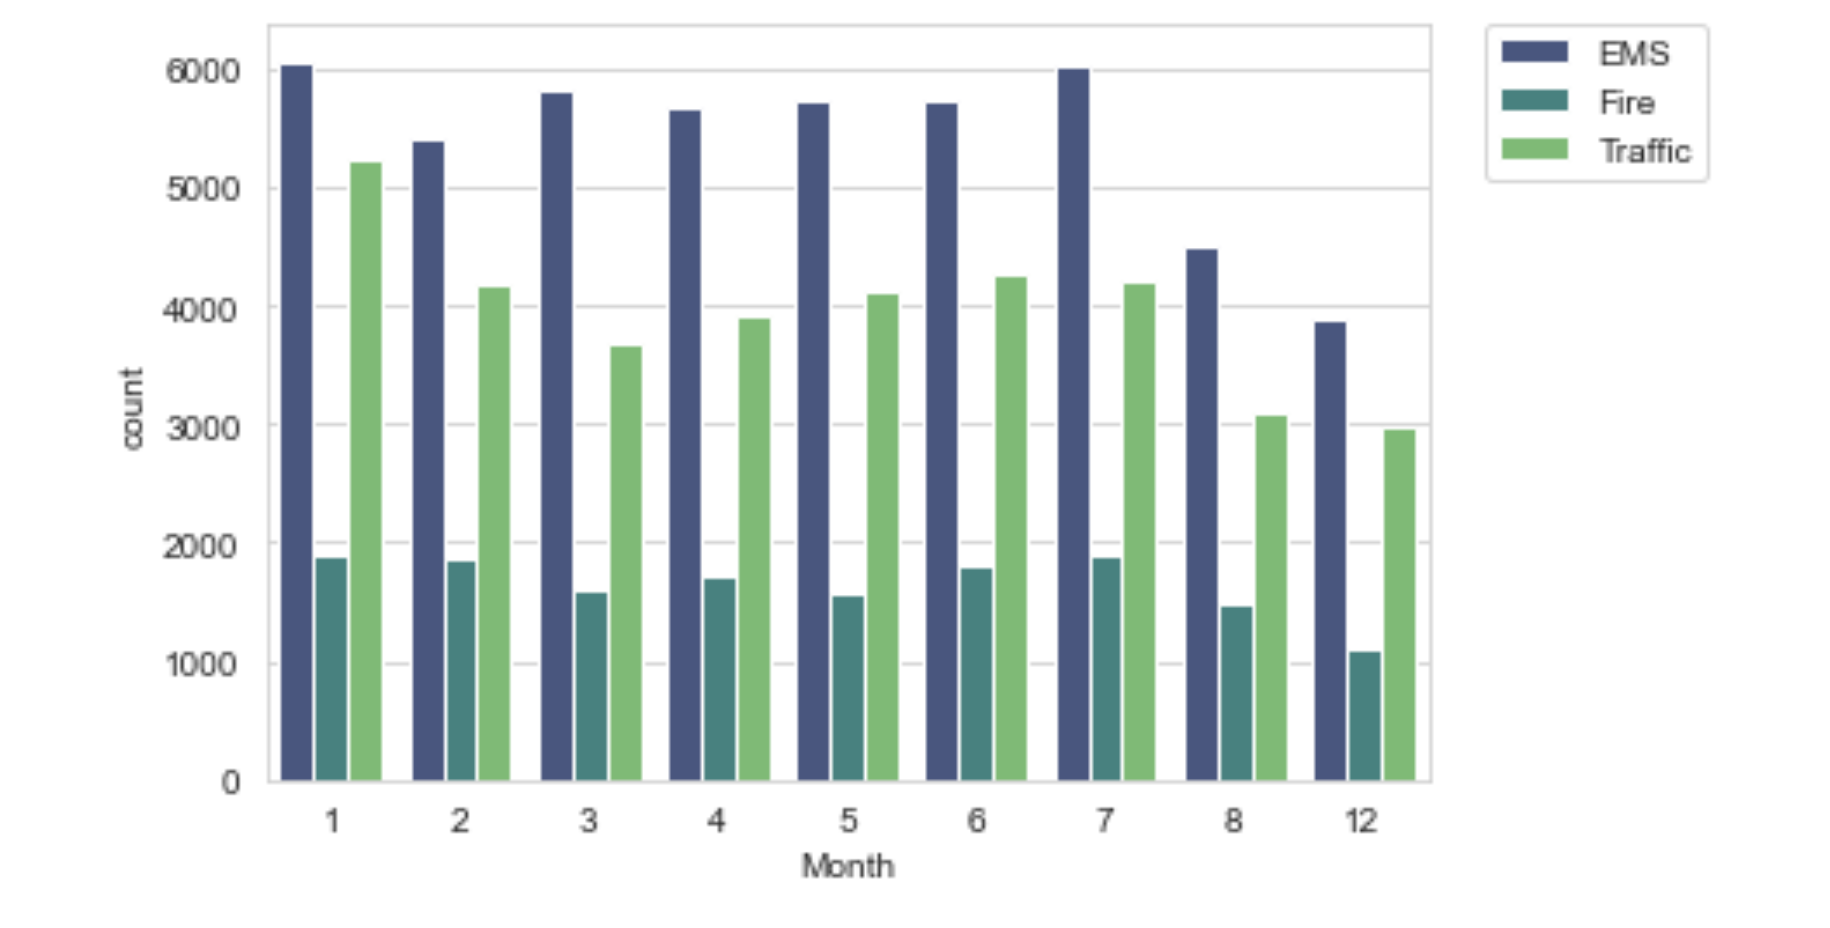
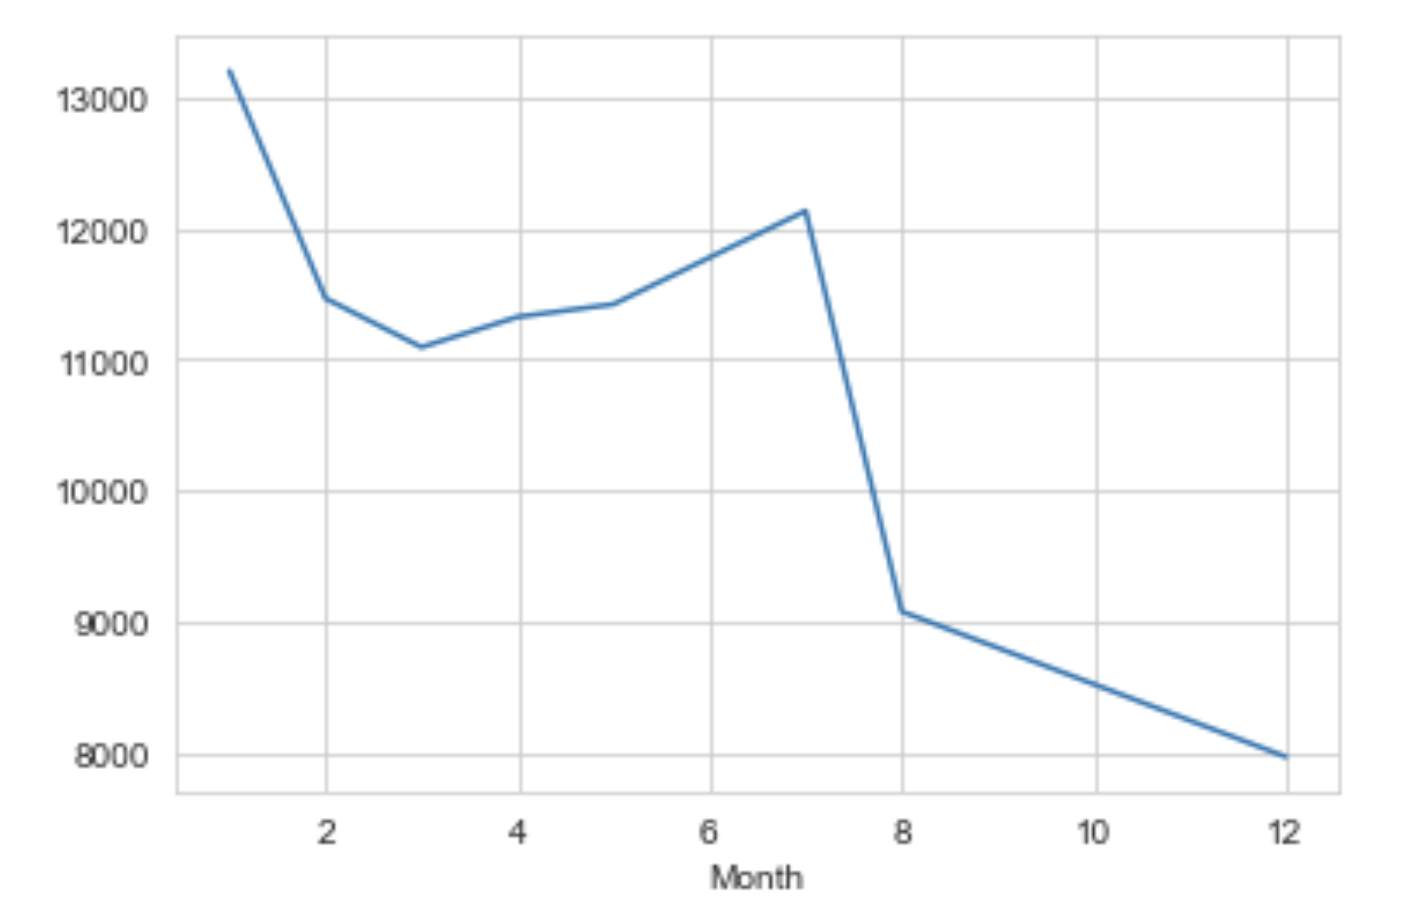
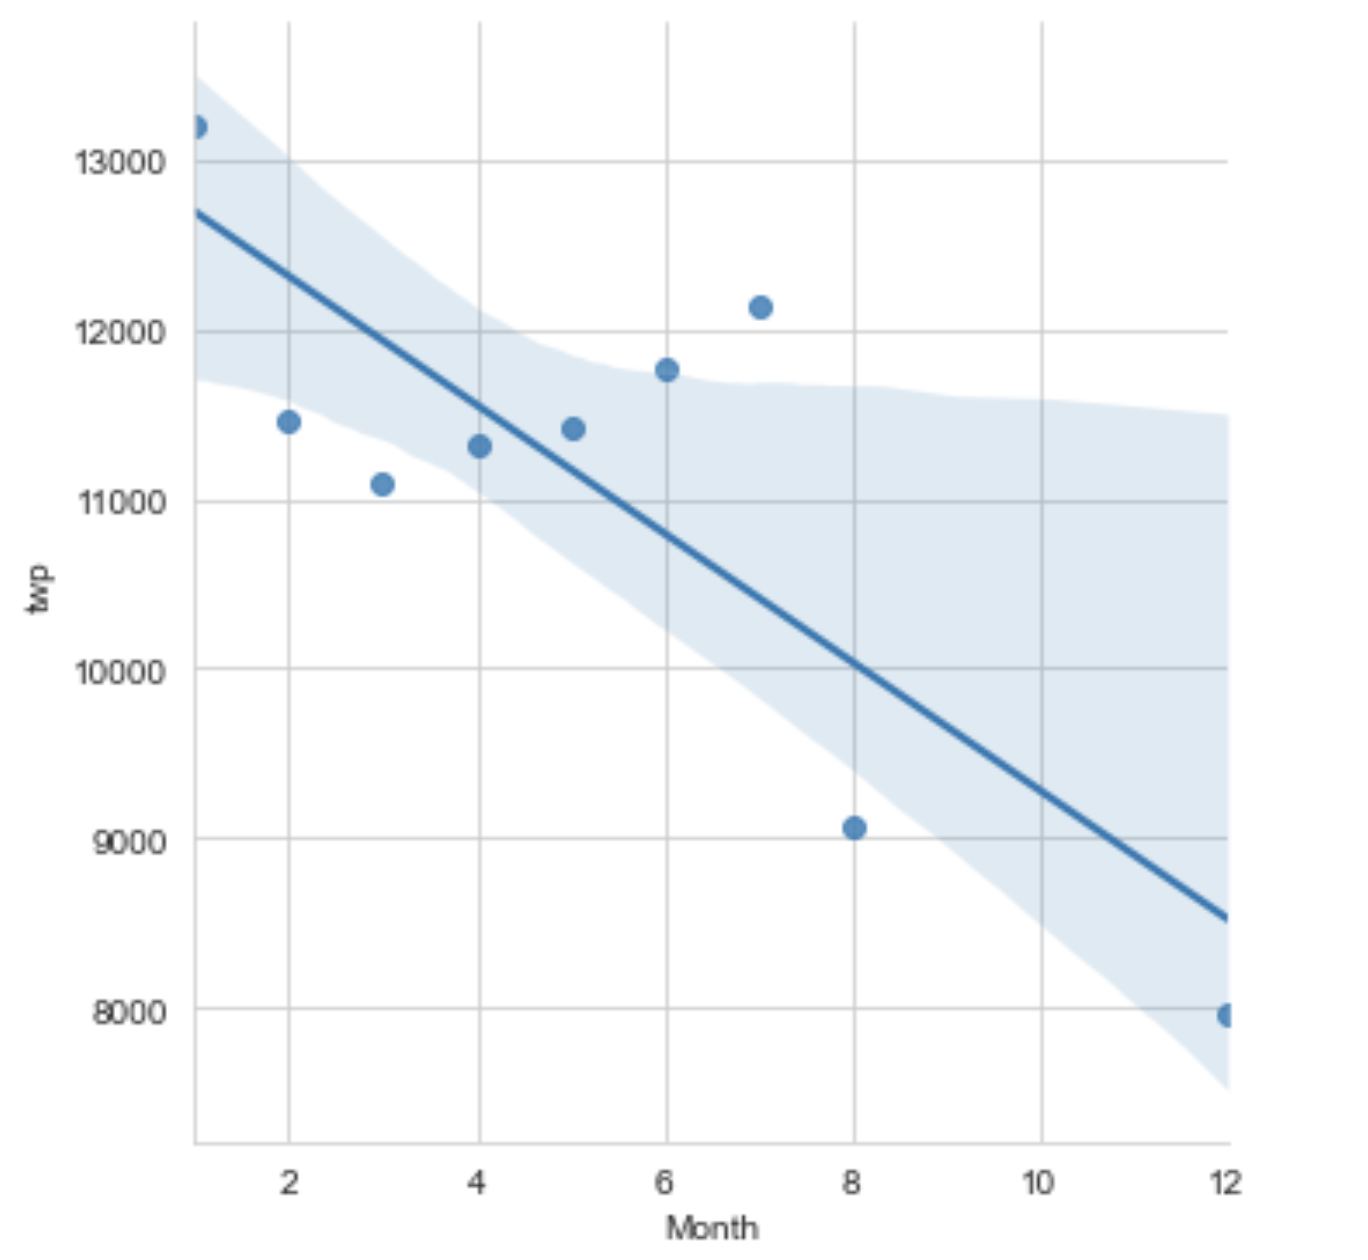
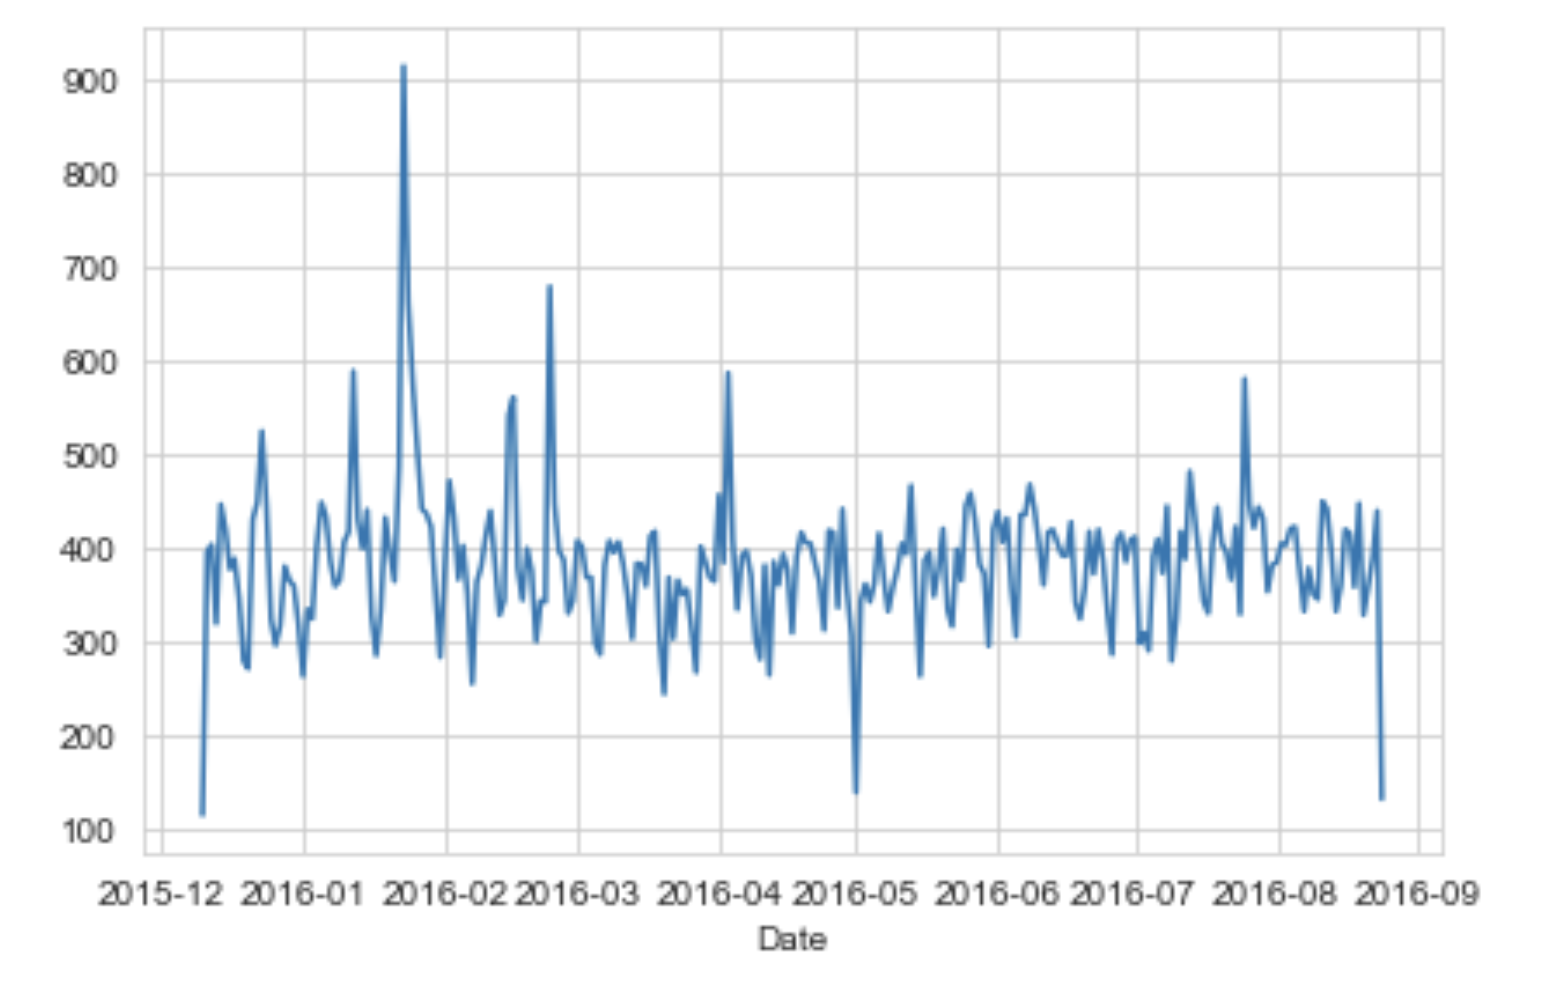
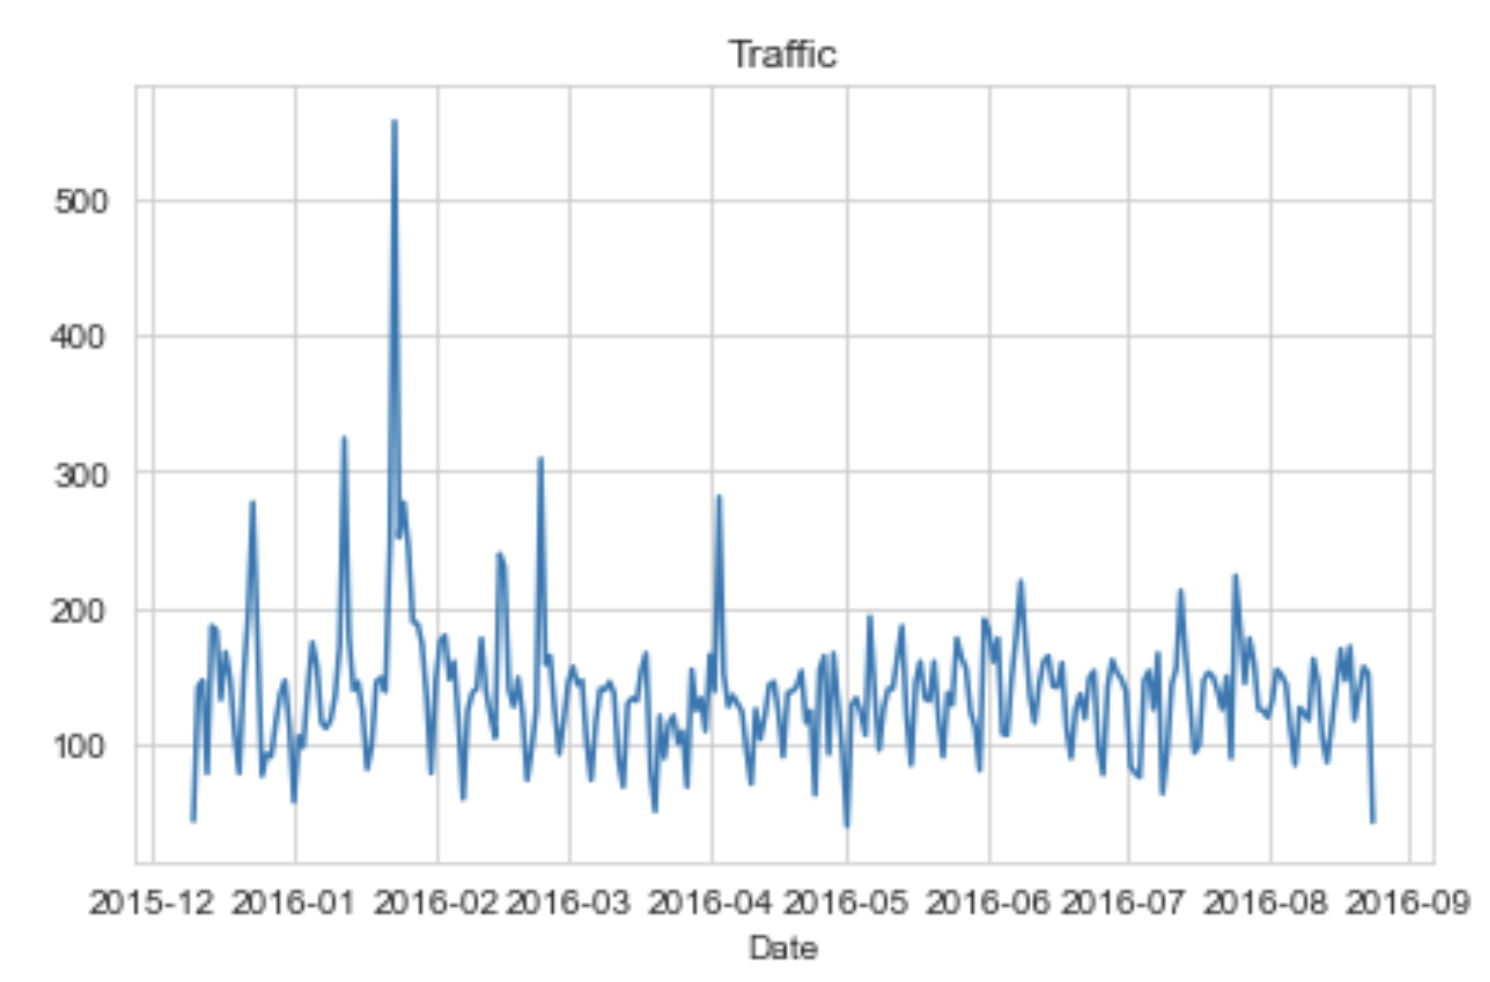
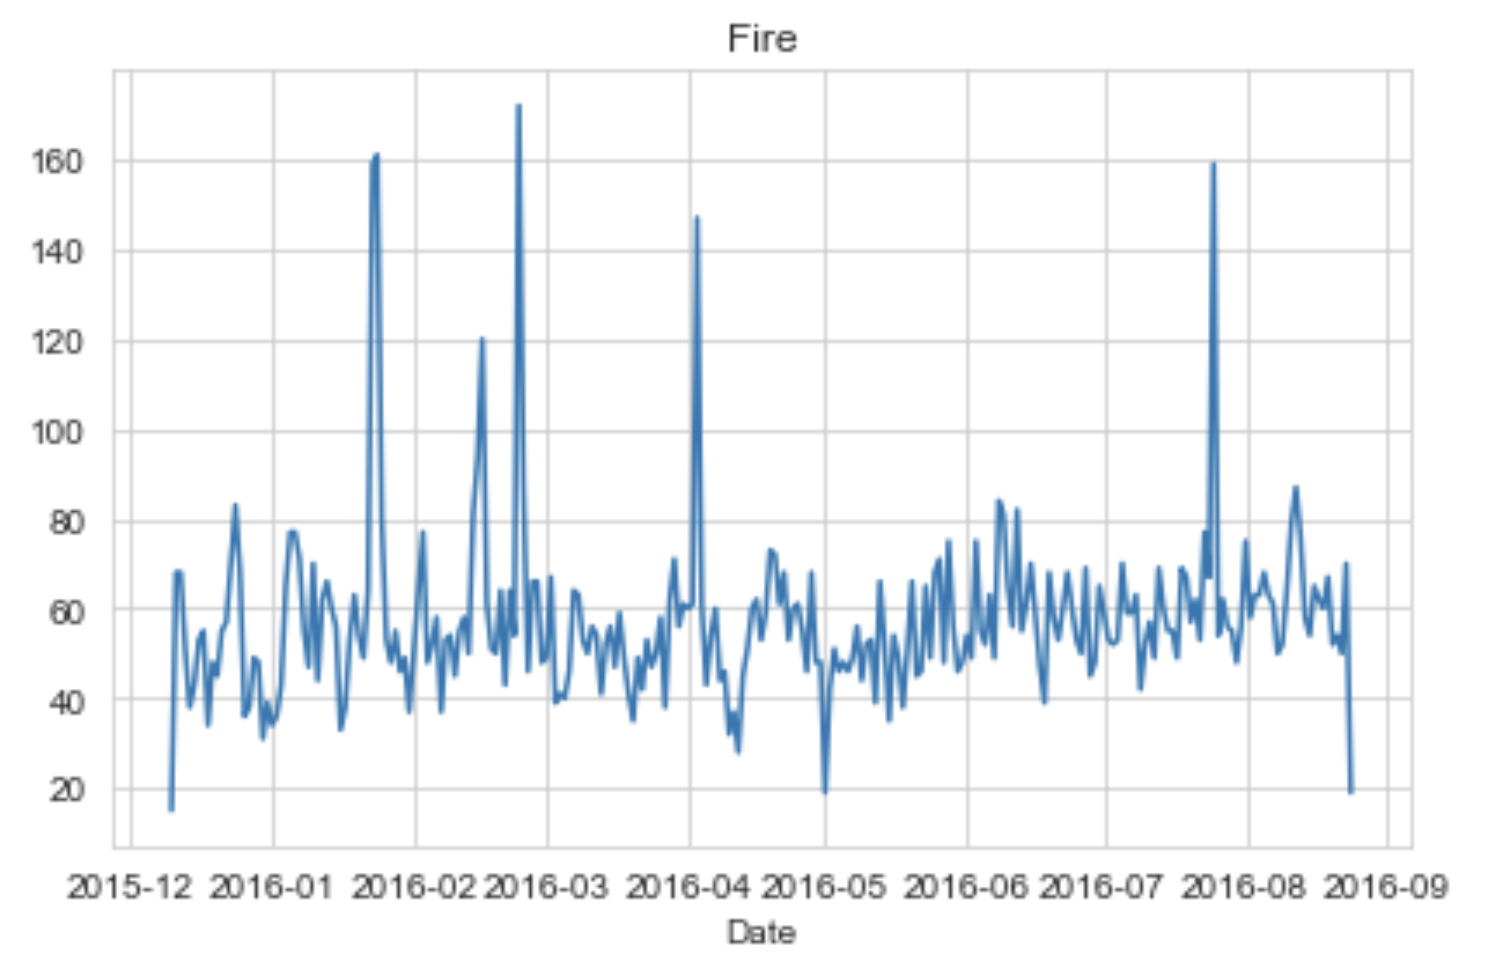
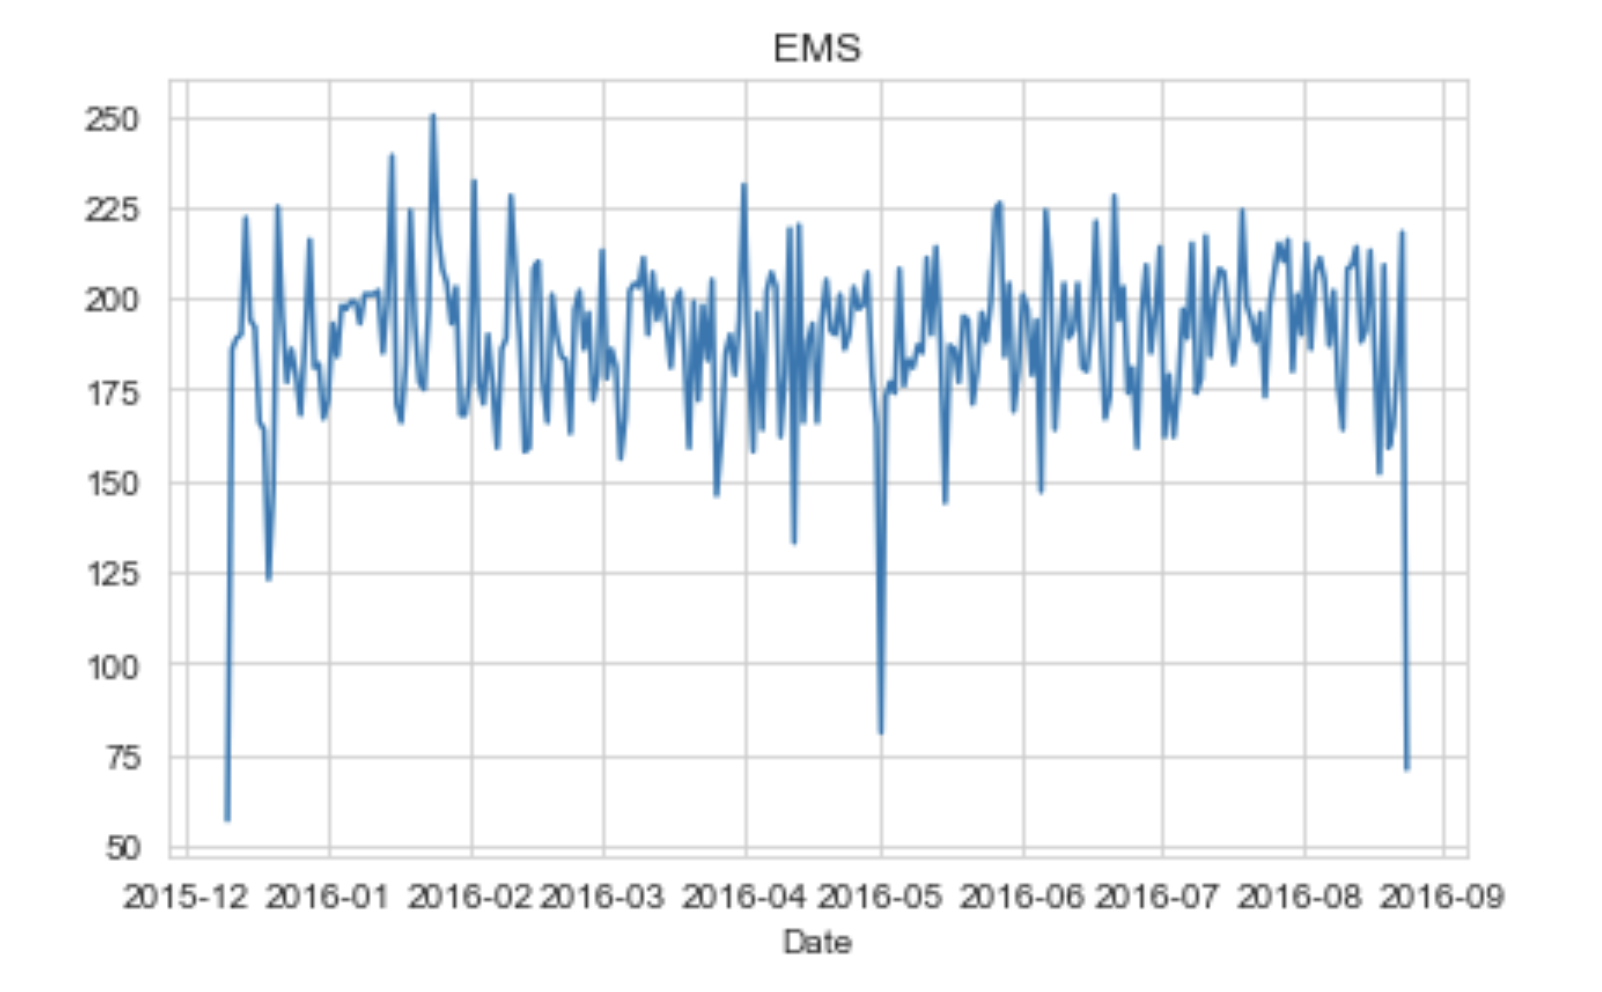
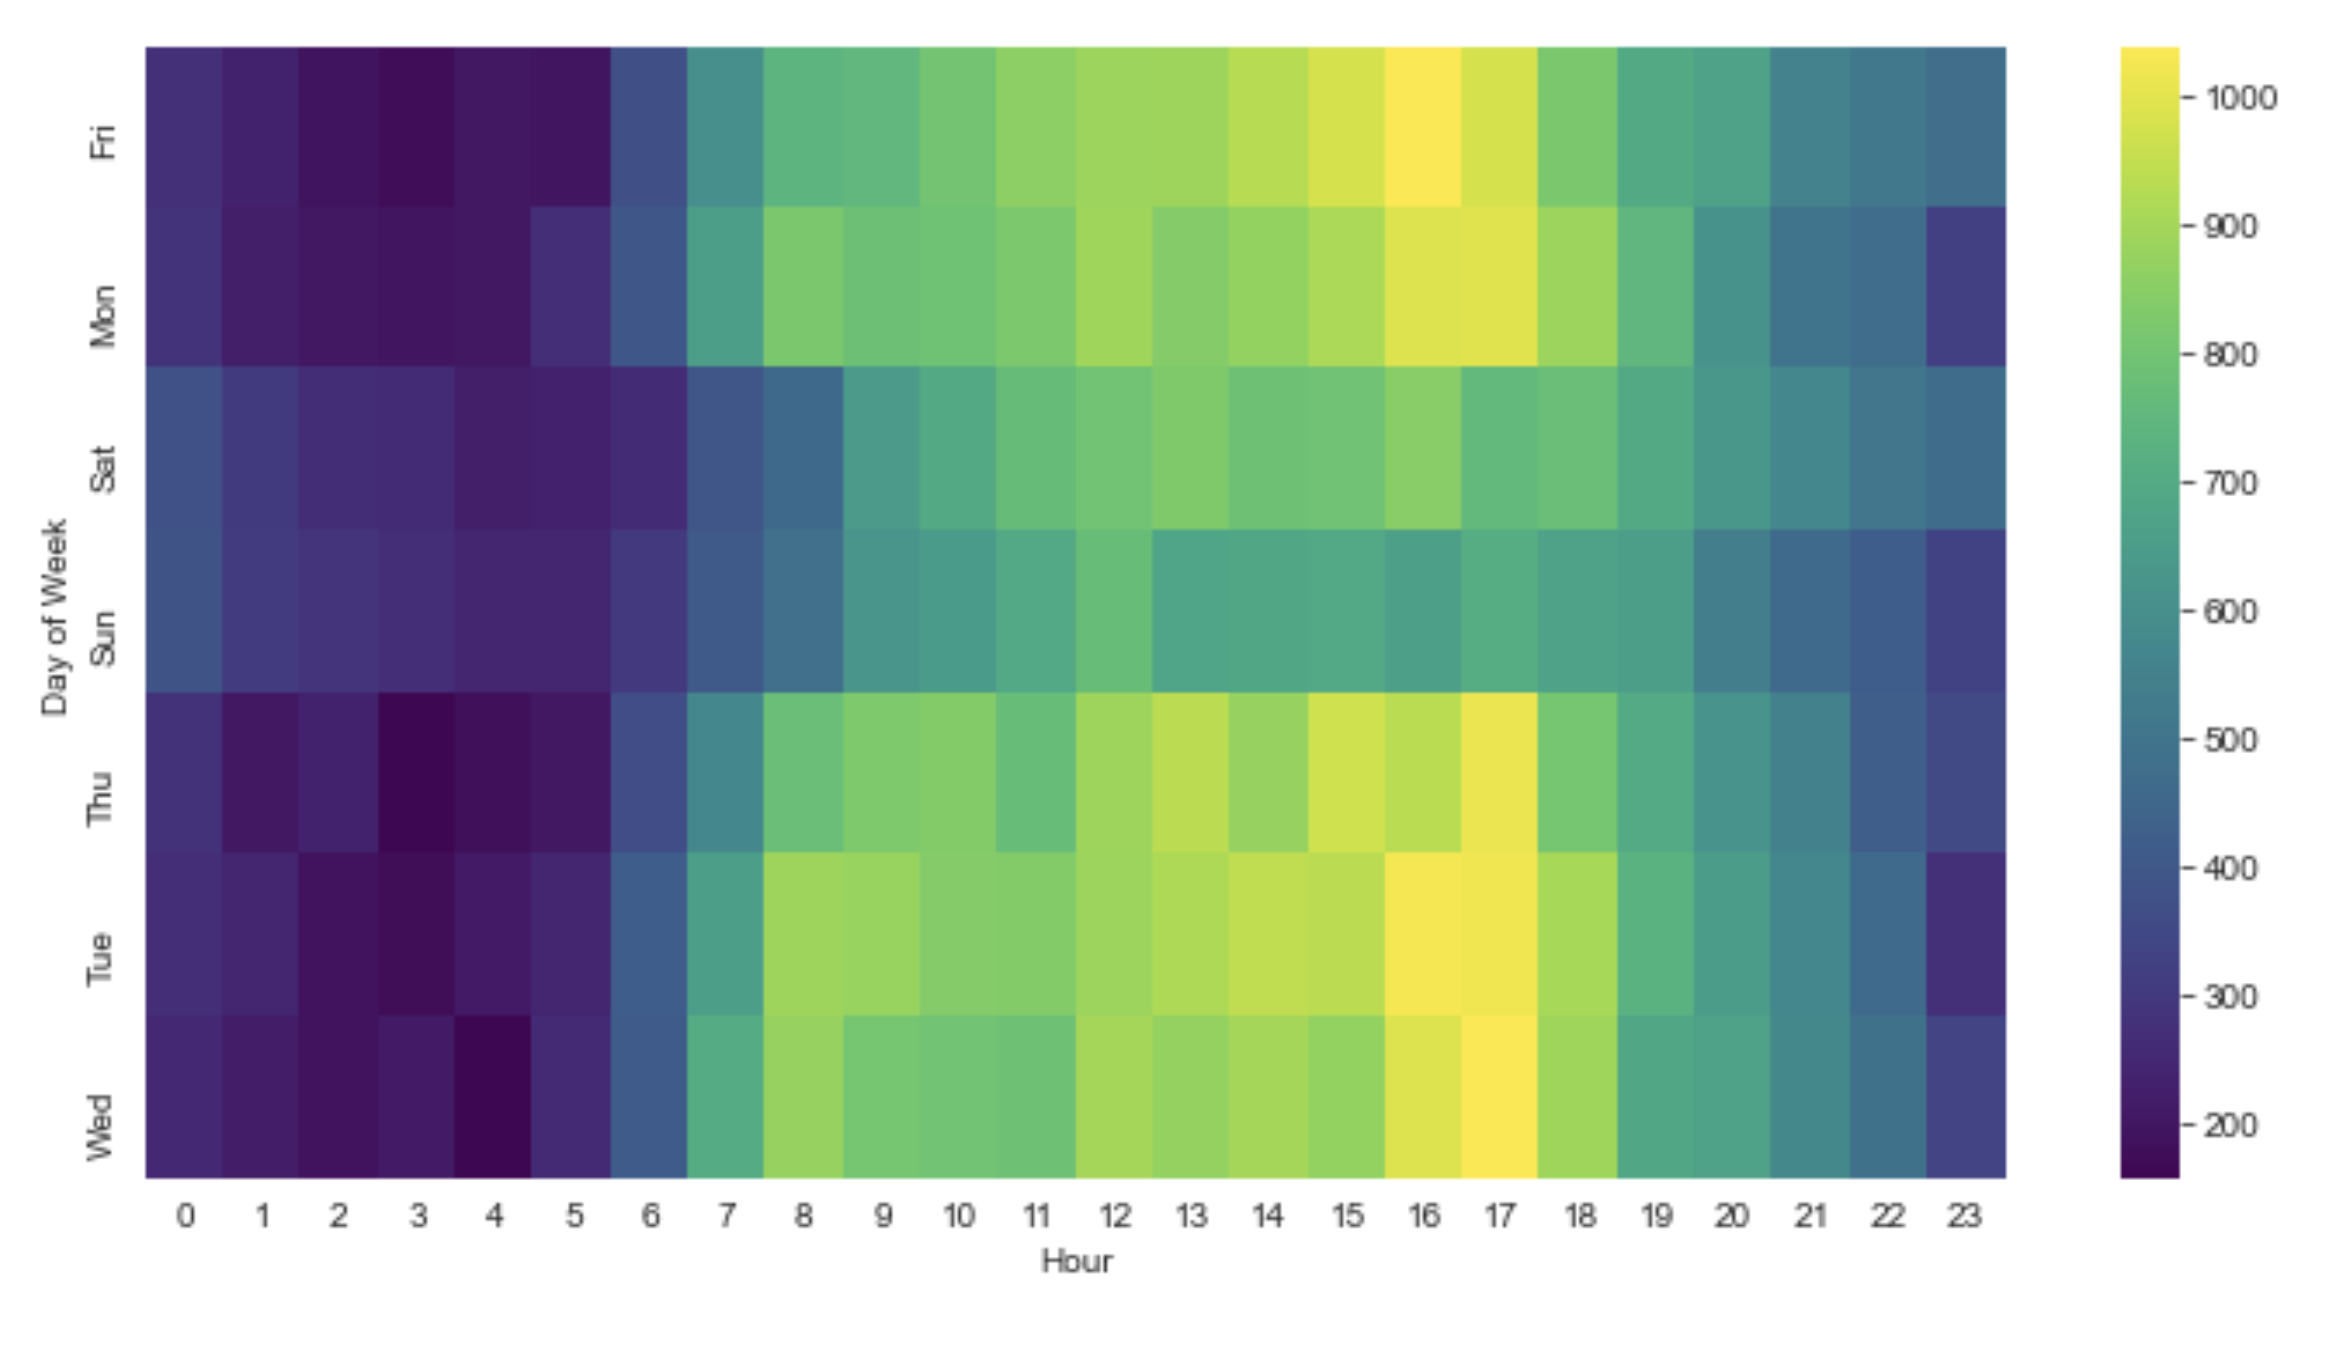
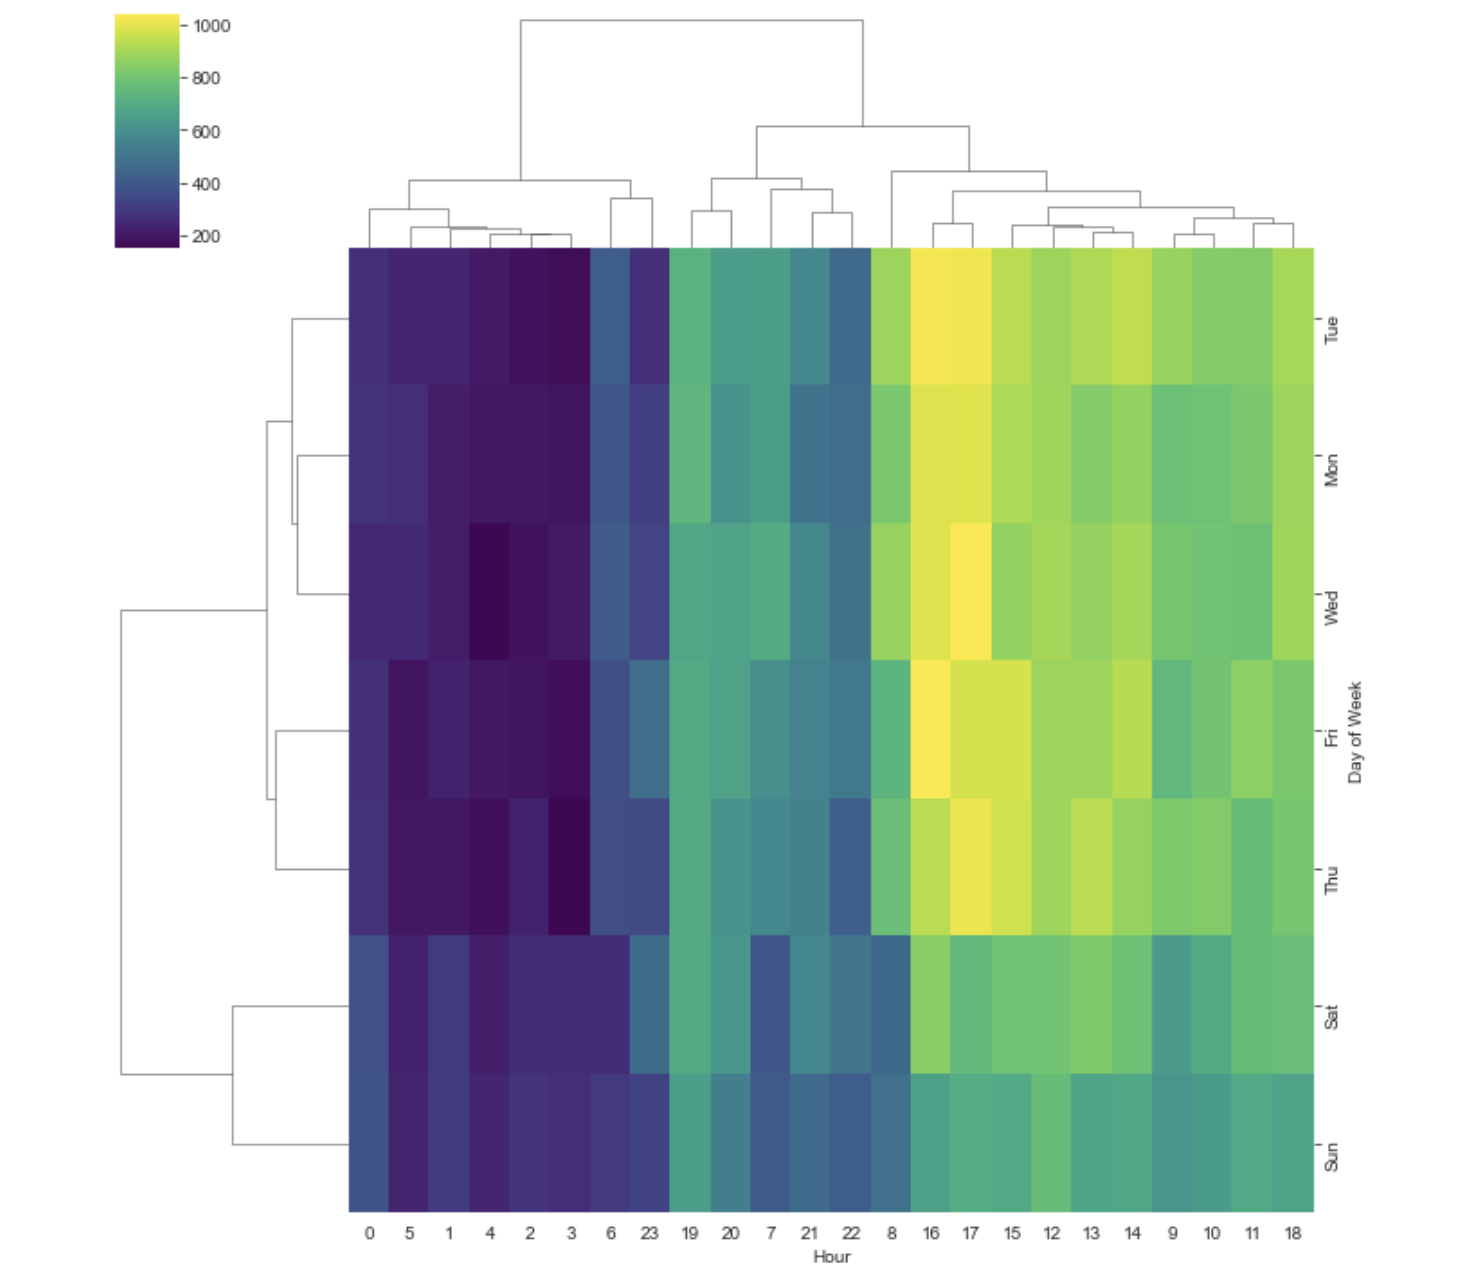
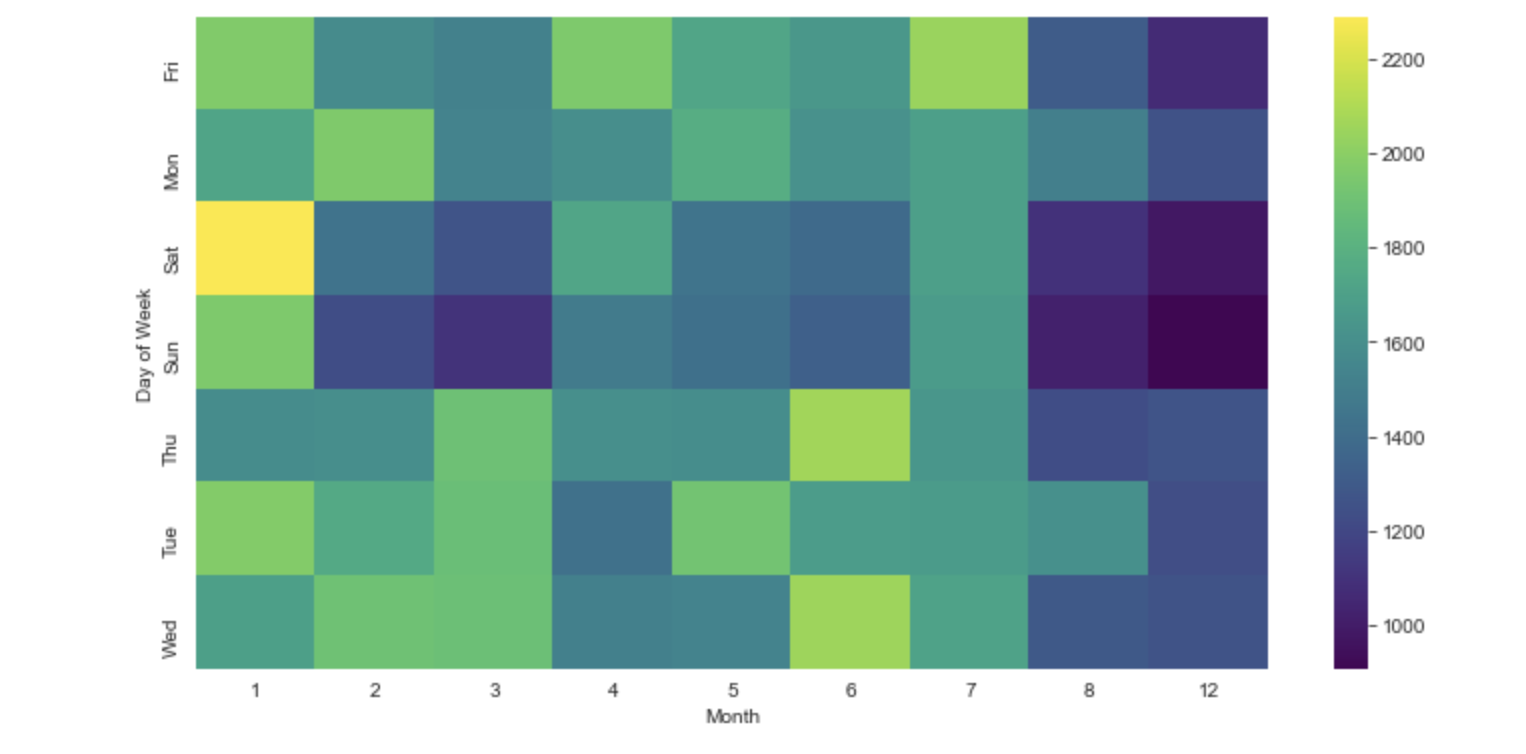
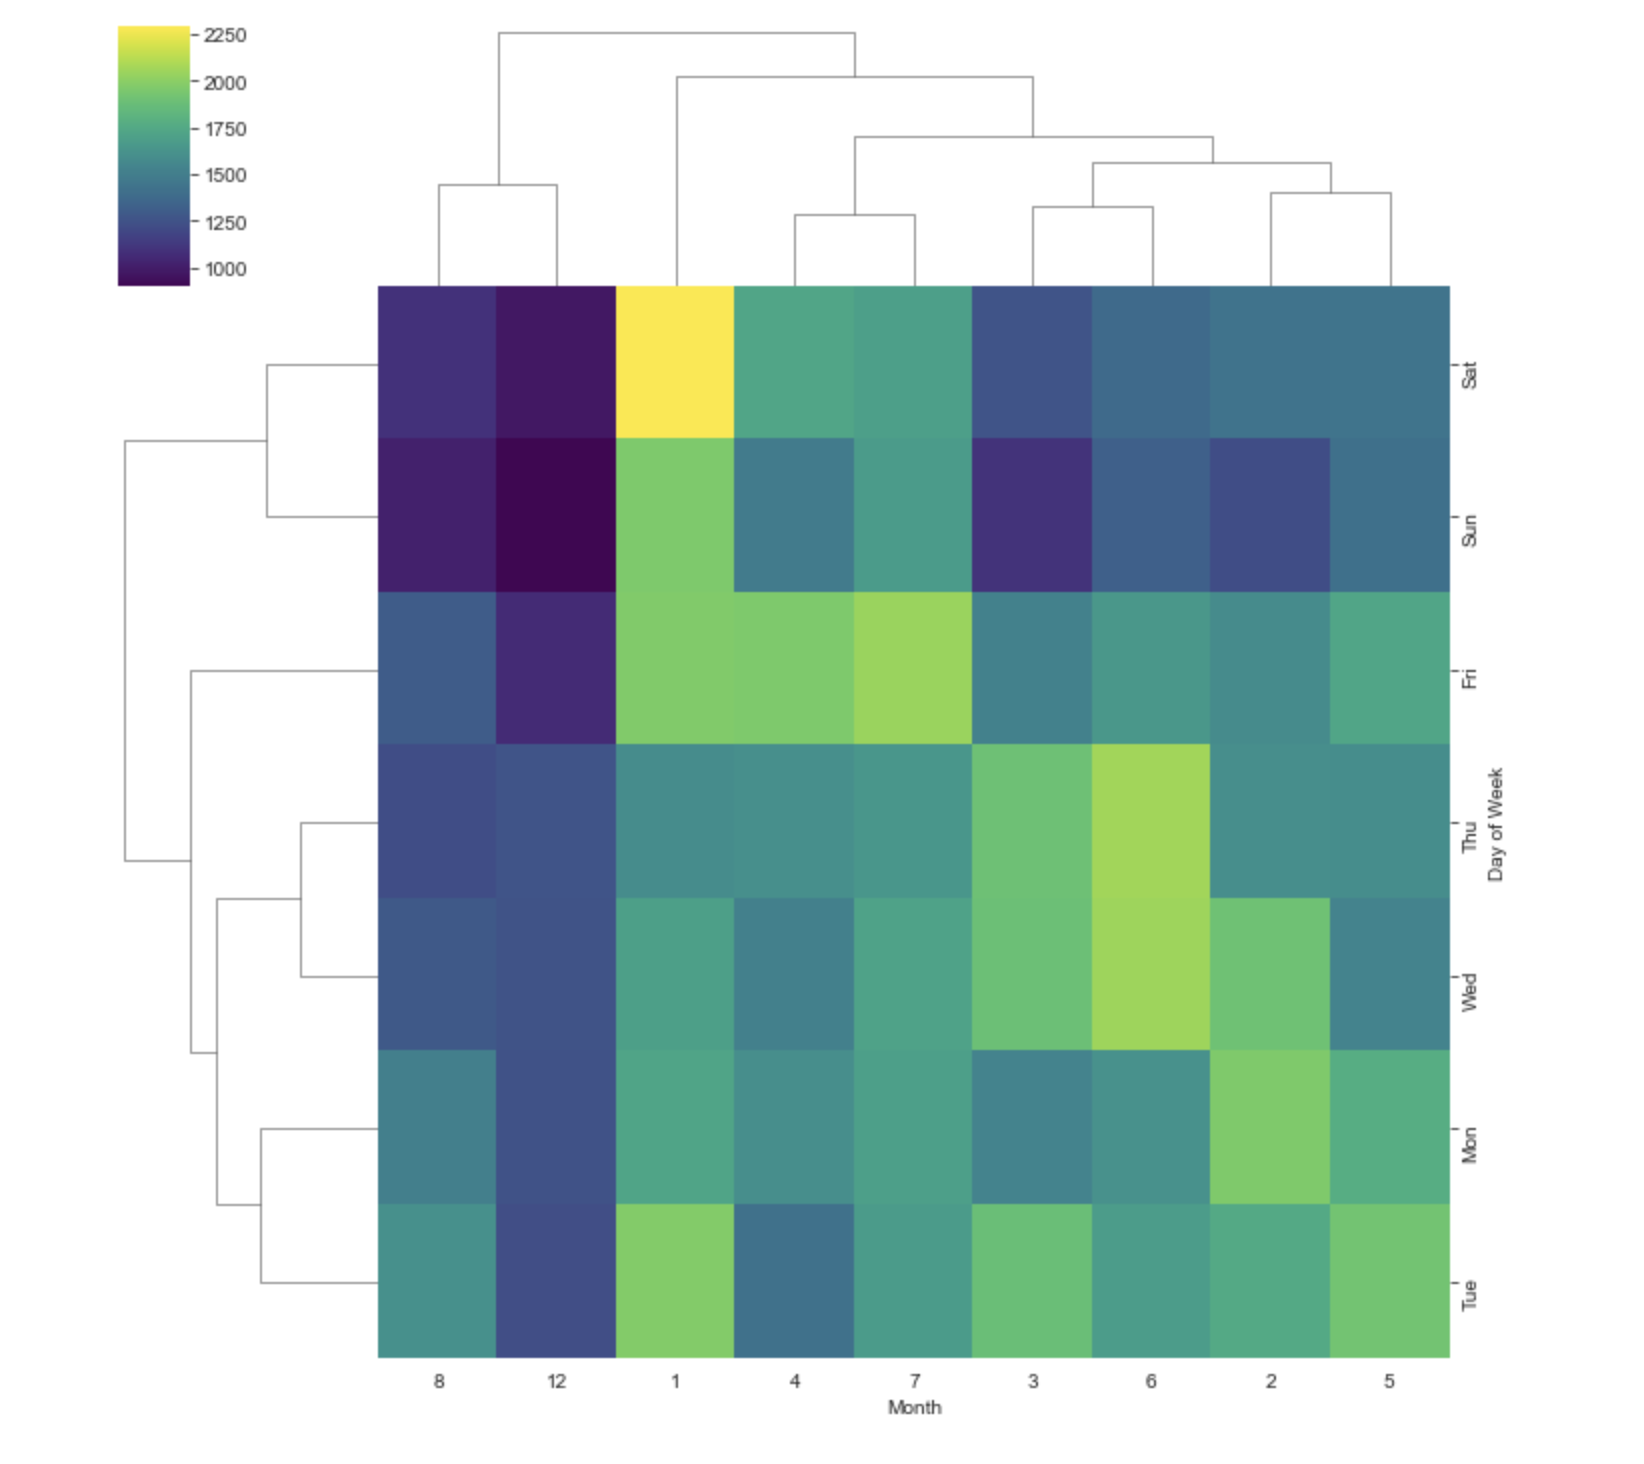
911 Calls Exploratory Data Analysis
~100,000 emergency calls from Montgomery County, PA
Key Findings
- • EMS: 48,877 calls (49%) — Most common
- • Traffic: 35,695 calls (36%)
- • Fire: 14,920 calls (15%)
- • Lower Merion township has the most calls
All Visualizations
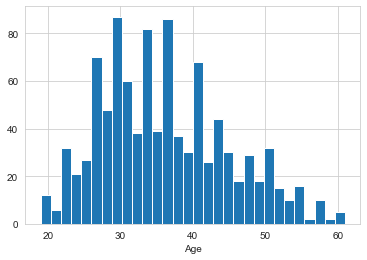
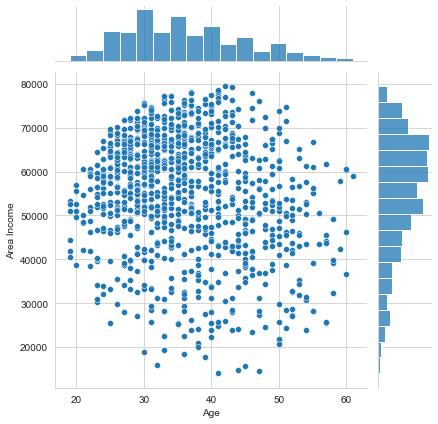
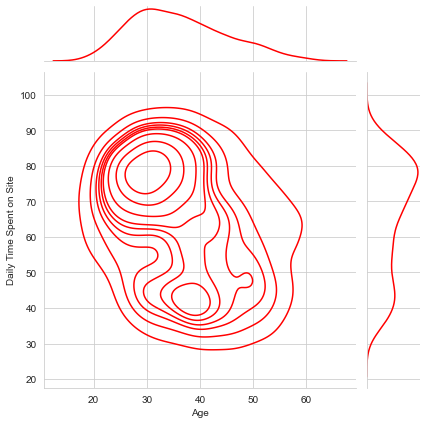
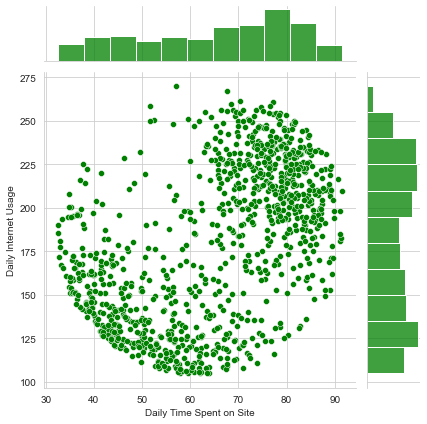
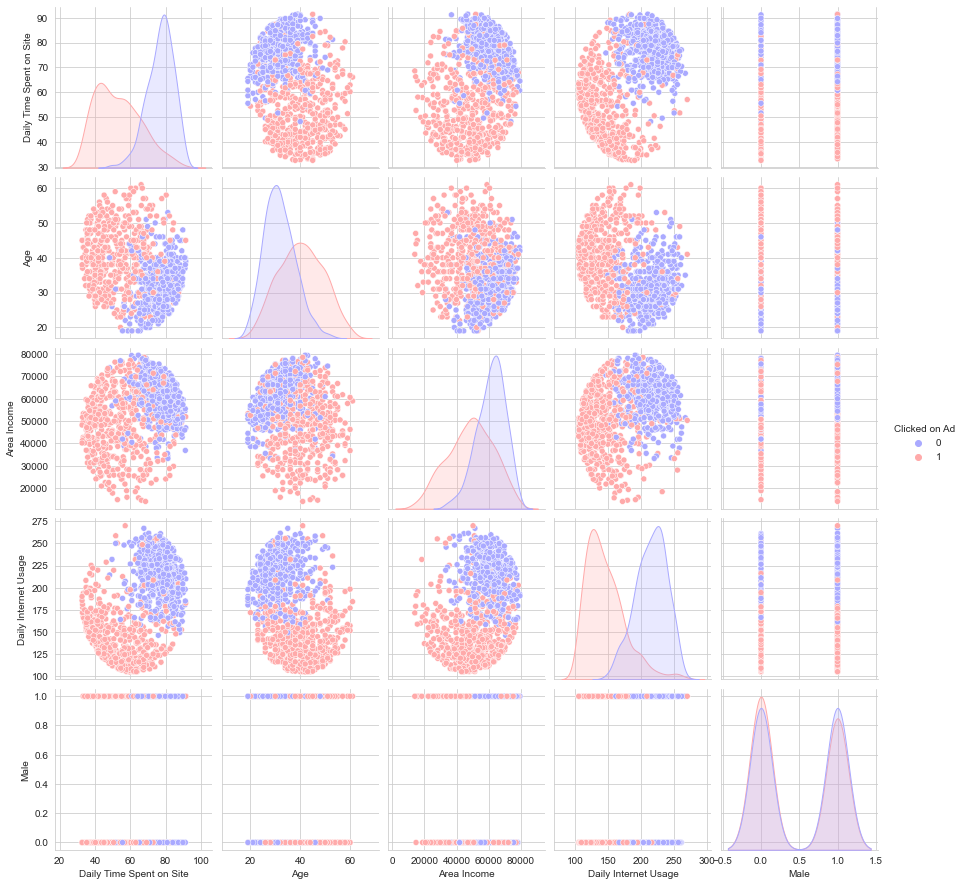
Advertising Click Prediction
Logistic Regression for ad click prediction
Predicting whether users will click on ads based on time on site, age, income, and internet usage. Clear separation visible between clickers and non-clickers.
All Visualizations

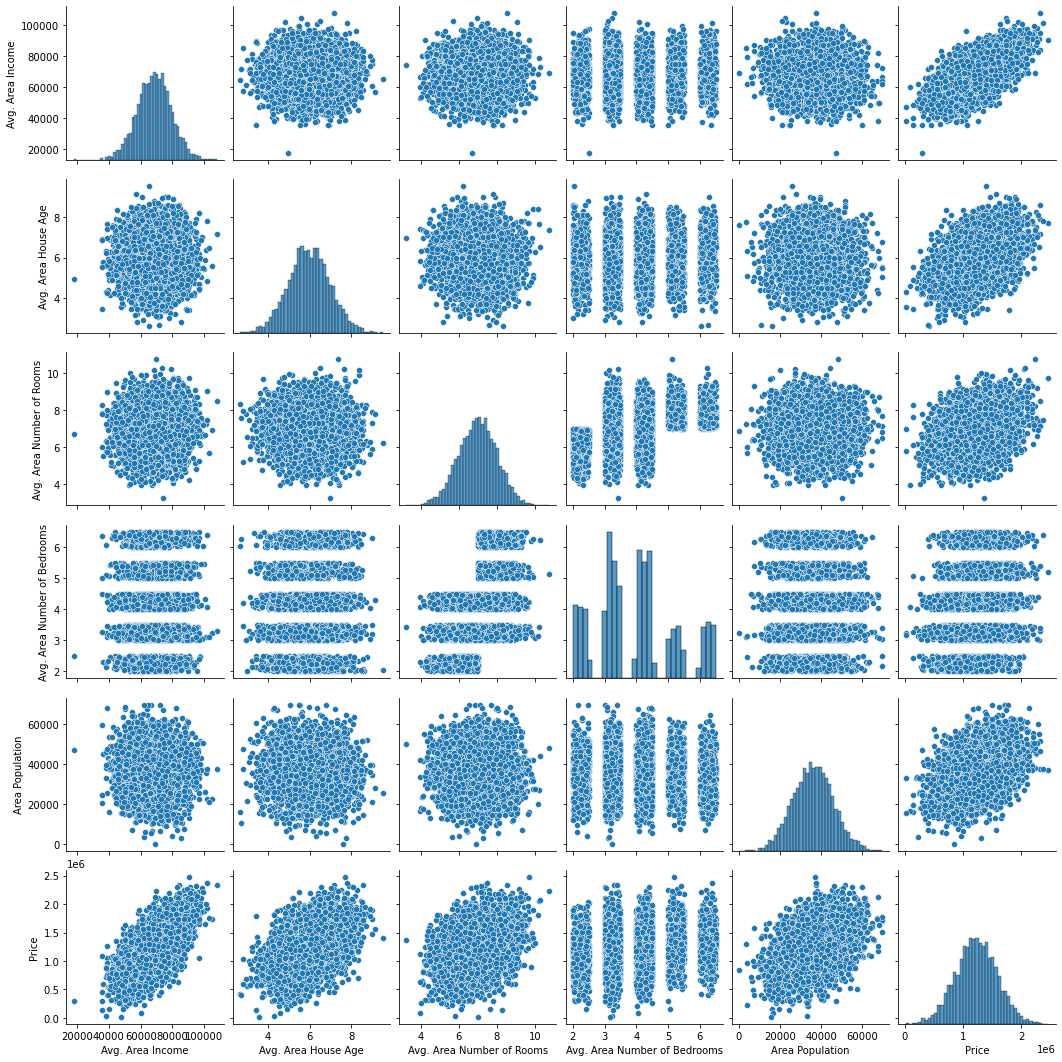
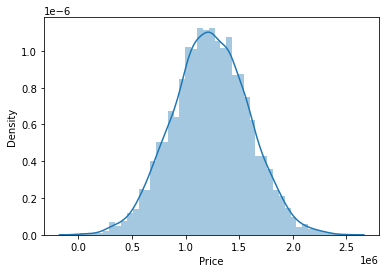
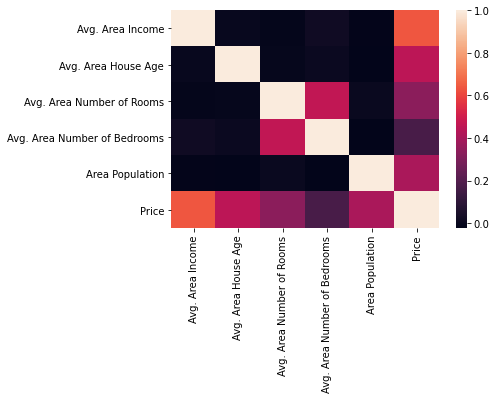
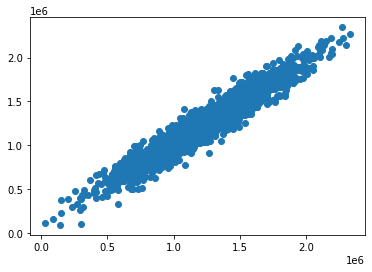
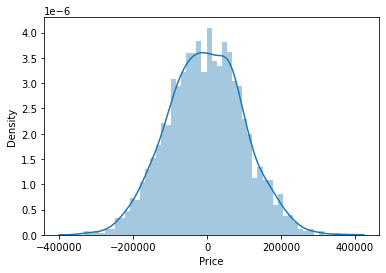
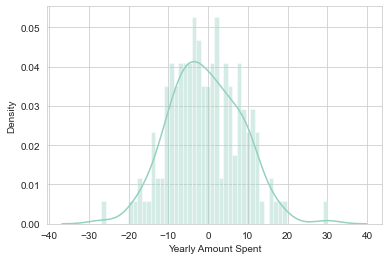
USA Housing Price Prediction
Linear Regression for price estimation
💡 Key Insight
Area income is the strongest predictor of house price. Model achieves good fit with normally distributed residuals.
All Visualizations
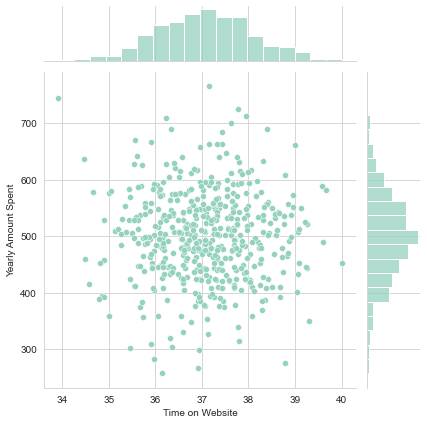
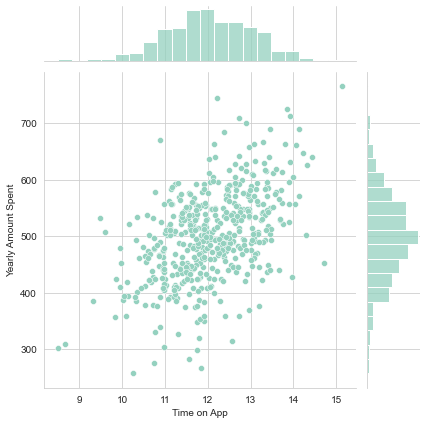
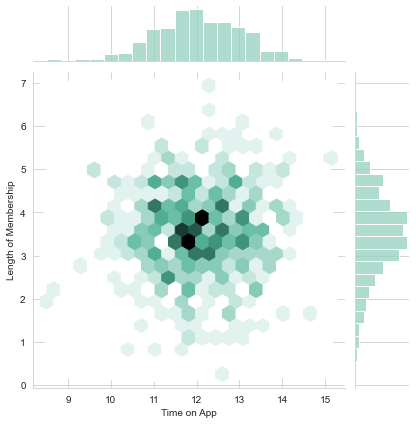
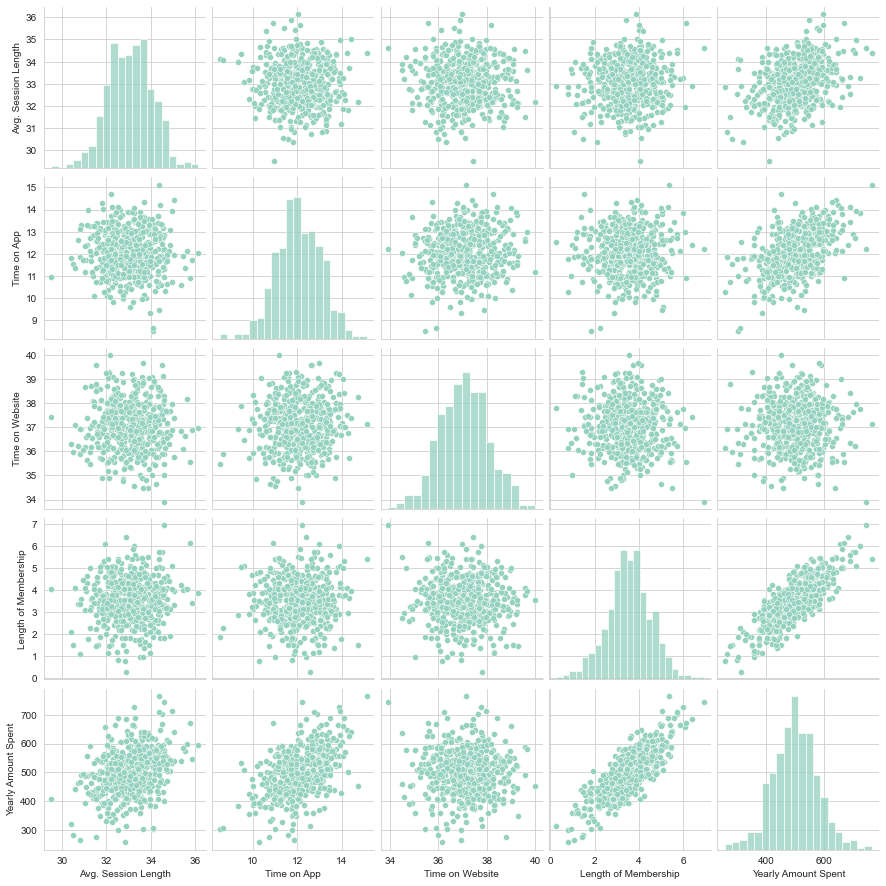
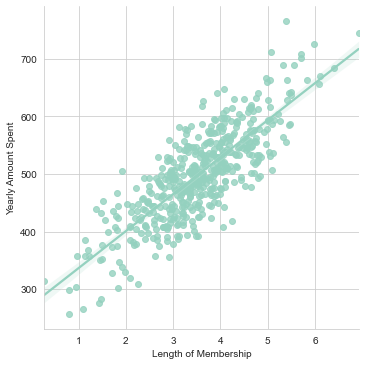
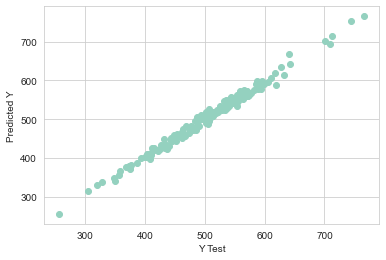
E-commerce Customer Analysis
Should they focus on mobile app or website?
💼 Business Recommendation
Mobile app drives more revenue per minute. Either develop the website to catch up, or double down on the app.
All Visualizations
Bank Stock Analysis
Analyzing the 2008 Financial Crisis
Analysis of Bank of America, CitiGroup, Goldman Sachs, JPMorgan, Morgan Stanley, and Wells Fargo during and after the 2008 crisis.
Analysis
- • Daily returns & risk assessment
- • Correlation heatmaps
- • Moving averages & Bollinger Bands
- • Candlestick charts
Findings
- • 2008 crash visible across all banks
- • CitiGroup most volatile
- • High correlation between banks
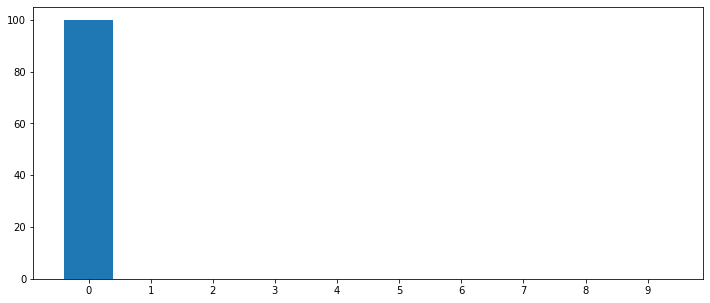
MNIST Digit Classification
The "Hello World" of Deep Learning
My first neural network! Classifying 70,000 handwritten digits (28×28 grayscale) into 10 classes.
Visualizations

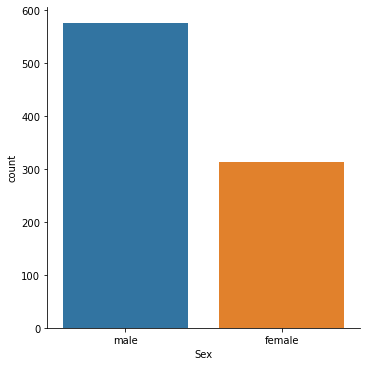
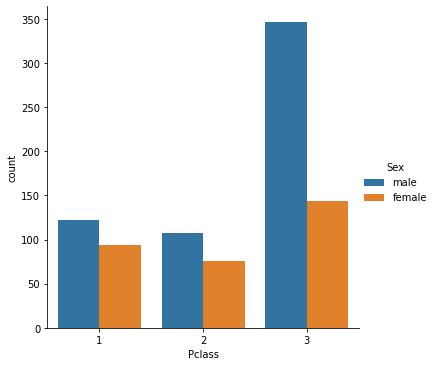
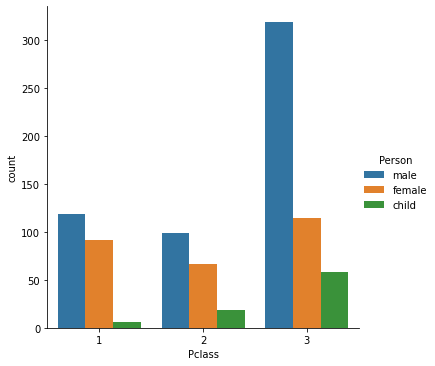
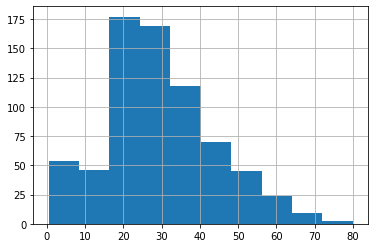
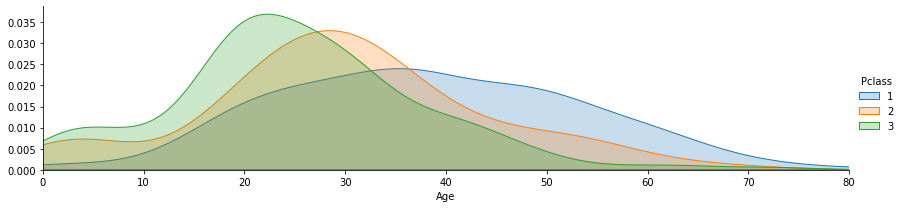
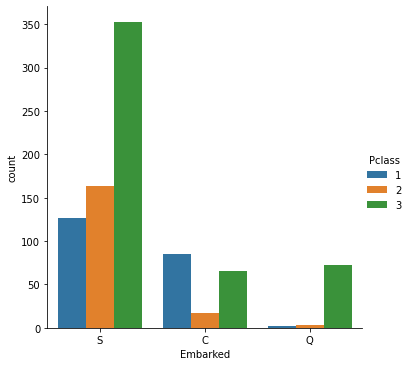
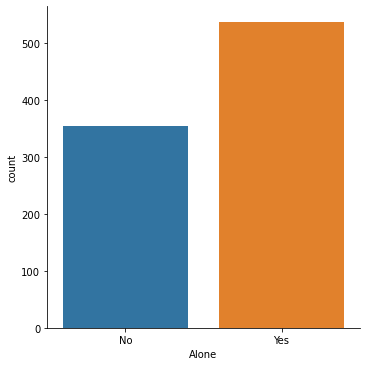
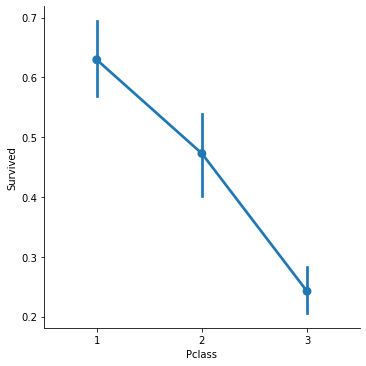
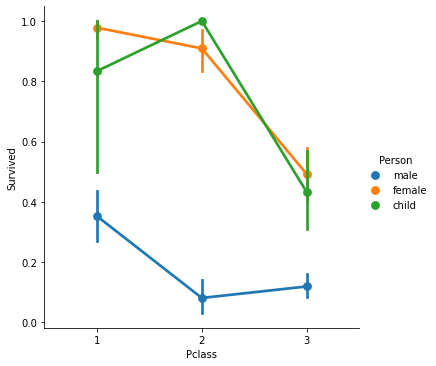
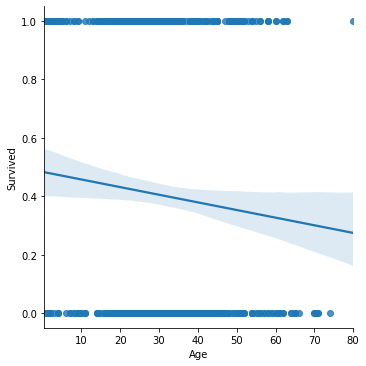
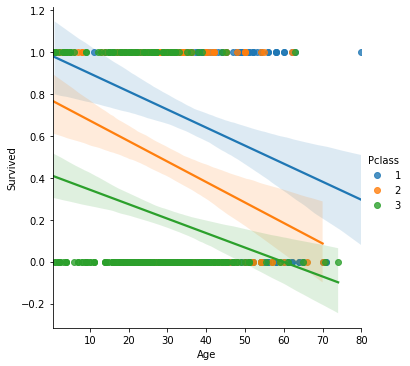
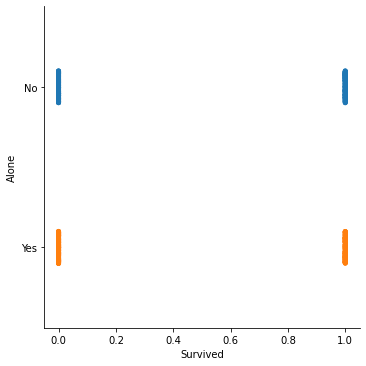
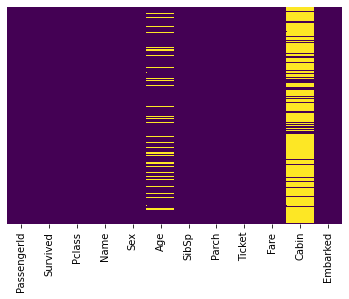
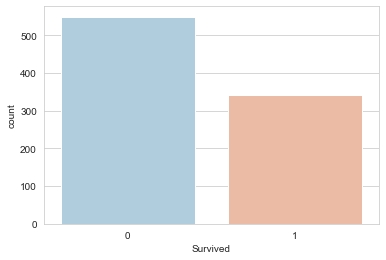
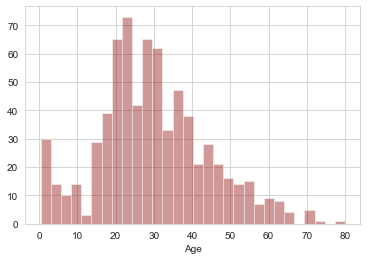
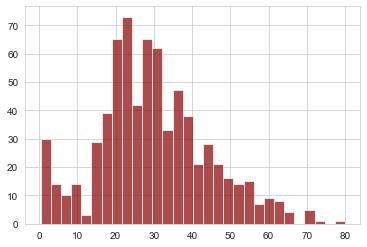
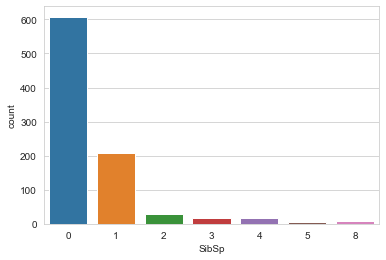
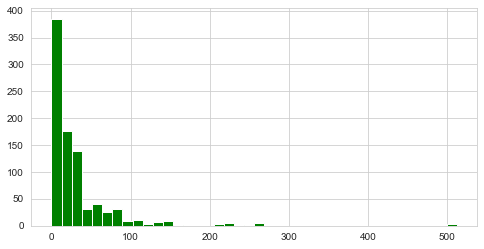
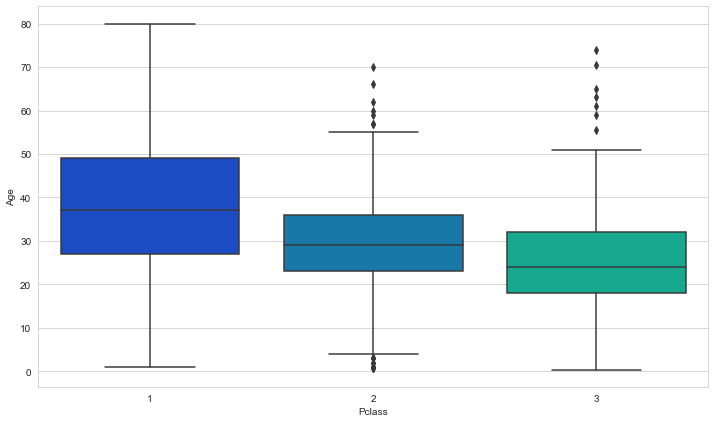
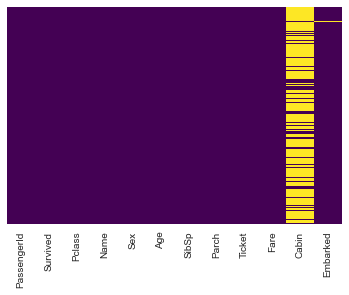
Titanic Survival Prediction
The classic Kaggle challenge
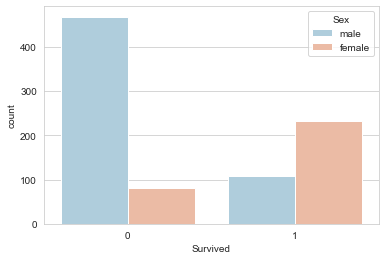
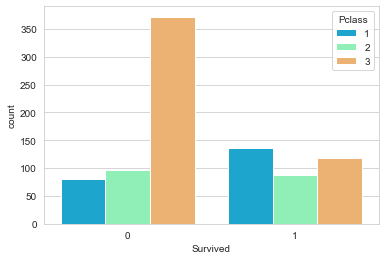
💡 Key Insights
- • "Women and children first" — females had much higher survival
- • Class matters — 1st class survived more
- • Higher fare = better survival
All Visualizations (22 plots)
Deep Learning Specialization
Andrew Ng's Coursera Course
Building neural networks from scratch — no frameworks, just NumPy.
Planar Data
2-layer network for non-linear classification
DNN from Scratch
Forward prop, backprop, gradient descent
Cat Classifier
L-layer network for image classification
🎓 What I Learned
- • Data manipulation with Pandas
- • Visualization with Matplotlib & Seaborn
- • ML models with Scikit-learn
- • Neural networks from scratch
- • EDA best practices
- • Feature engineering
- • Model evaluation metrics
- • Business insights from data